World Turbine Market to Grow 5.1% annually from 2014 to 2018

Global demand for turbines is forecast to expand 5.1% p.a. between 2014 – 2018. China, Greece, Lithuania, Macedonia, and the United States are considered the highest potential markets in the coming years.
According to recently published research conducted by a leading international market research company, Global Research & Data Services, the expansion of the global turbine industry is forecast to reach 5.1% p.a. in the coming years. Between 2007 and 2013 the market increased with an average annual growth of 5.1%. Currently, gas turbines account for 69.9% of the global demand while the remaining market share is divided between steam and vapour turbines (25.3%), and hydraulic turbines and water wheels (4.9%).
China, Italy, Japan, the United Kingdom, and the United States represent the largest turbine markets while the strongest annual growth is forecast to occur in Greece (37.3%), Macedonia (28.6%), Lithuania (27.3%), Slovakia (26.6%), and Georgia (16.7%).
Turbine market size compared to market growth in different countries
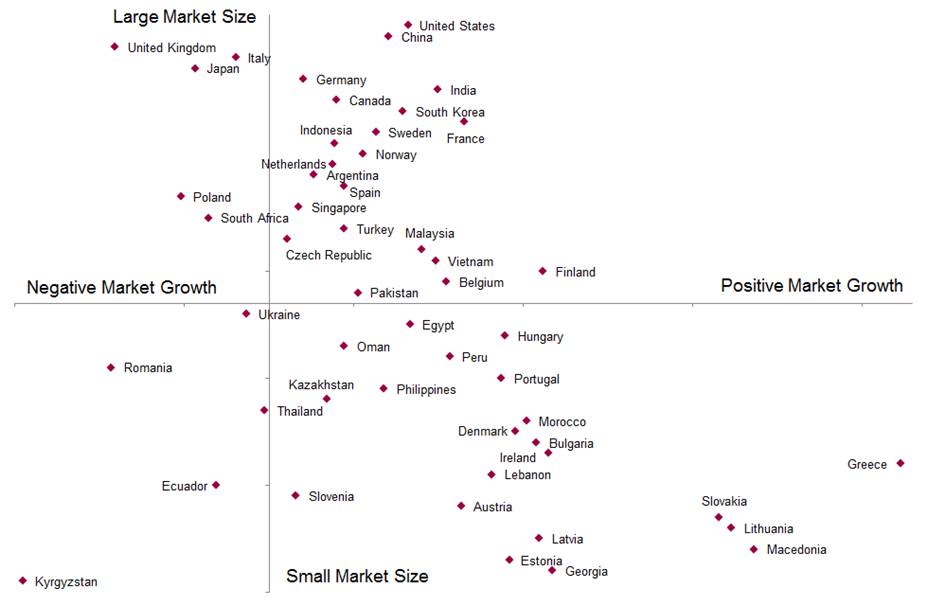
Based on in-house analysis and an advanced model which takes into consideration the actual market size, trends, forecast market growth, and changes in the market environment, Global Research and Data Services calculates the Market Potential Rates, the predicted market potential of the country in the coming years. The larger the Market Potential Rate, the more potential the market has in the coming years; and conversely, the smaller the rate, the less potential the market is considered to have in the future. Based on these Market Potential Rates, the top 20 highest potential turbine markets in the coming years are:
Ranking | Country | Market Potential Rate |
|---|---|---|
1. | United States | 0.52 |
2. | Greece | 0.37 |
3. | China | 0.36 |
4. | Macedonia | 0.29 |
5. | Lithuania | 0.27 |
6. | Slovakia | 0.27 |
7. | India | 0.17 |
8. | Finland | 0.17 |
9. | Georgia | 0.17 |
10. | Ireland | 0.17 |
11. | Latvia | 0.16 |
12. | Bulgaria | 0.16 |
13. | Morocco | 0.15 |
14. | France | 0.15 |
15. | Denmark | 0.15 |
16. | Hungary | 0.15 |
17. | Estonia | 0.14 |
18. | Portugal | 0.14 |
19. | Lebanon | 0.13 |
20. | South Korea | 0.12 |
Countries covered in reports:

The market information is based on new industry reports recently published by Global Research & Data Services. The publications offer the most up-to-date perspective on the actual market situation, trends, leading companies, and future outlook for turbines in the world and individually for the following countries:
Argentina, Austria, Belgium, Bulgaria, Canada, China, Czech Republic, Denmark, Ecuador, Egypt, Estonia, Finland, France, Georgia, Germany, Greece, Hungary, India, Indonesia, Ireland, Italy, Japan, Kazakhstan, Kyrgyzstan, Latvia, Lebanon, Lithuania, Macedonia, Malaysia, Morocco, Netherlands, Norway, Oman, Pakistan, Peru, Philippines, Poland, Portugal, Romania, Singapore, Slovakia, Slovenia, South Africa, South Korea, Spain, Sweden, Thailand, Turkey, Ukraine, United Kingdom, United States, Vietnam
The studies include historic market data from 2007 to 2013 and forecasts until 2018 which makes the reports an invaluable resource for industry executives, marketing, sales and product managers, analysts, and other industry professionals looking for key market insights in a readily accessible and clearly presented format.
The market studies help identify:
- What is the size of the global turbine market?
- What is the size of the turbine market in different countries around the world?
- How are the markets divided into different product segments?
- Which products are growing fast?
- How have the markets been developing?
- What does the future look like?
- What is the market potential?
- Which major companies are operating in the market?
Product segments analyzed in the studies:
Major players in global turbine market covered in these reports are:
Eletsgidroagregat Oao, Energomash (Sysert) Uralgidromash Zao, Gamesa Corporacion Tecnologica SA, GE, Gms Neftemash Oao, Hangzhou Steam Turbine Co., Ltd., Harbin, Honda Siel Power Products Limited, Howmet Castings & Services, Inc. - Whitehall Casting, IHI Corporation, Izhneftemash Oao, Jiangsu Jixin Wind Energy Technology, Jiar Travelware Co Ltd, Kaluzhskiy turbinnyi zavod OAO, Kryvoriz'kyi turbinnyi zavod Konstar PAT, Leningradskiy Metallurgical Plant Joint Stock Company, MAN Diesel & Turbo, Mitsubishi Heavy Industries, Ltd., Nanjing Turbine&Electric Machinery(Group) Co.,Ltd., Nordex SE, Northrop Grumman Marine Systems, NPO Iskra OAO (P), Powerica Ltd, Shanghai Dianqi Power Station Equipment Co.,Ltd, Shanghai Electric Group Company Limited, Siemens, Sinovel Wind Group Company Limited, Solar Turbines Inc, Suzlon Energy Limited, Turbine Engine Components Technologies Corp., Turbo Energy Limited, Turboatom VAT, Tuthill Corporation, Vestas, Wolong Electric Group Co., Ltd., Woodward Inc, Wuhan Steam Turbine Factory, WuXi Turbine Blade Company Limited, Xiangtan Electric Manufacturing Co.,Ltd., Xinjiang Goldwind Science & Tech Co Ltd, and Zhejiang Fuchunjiang Hydrpwr Equip Co Ltd.
Related Reports:
Turbine Markets in the World to 2018- Market Size, Trends, and Forecasts


About The Author