1 Market Overview
1.1 Rotating U Disk Introduction
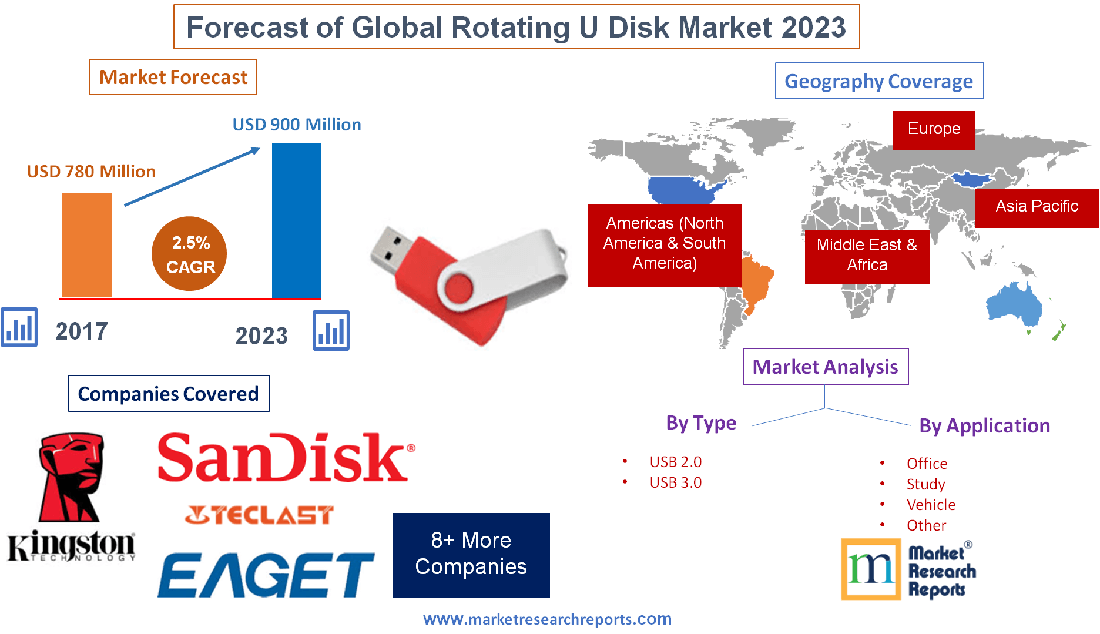
1.2 Market Analysis by Type
1.2.1 USB 2.0
1.2.2 USB 3.0
1.3 Market Analysis by Applications
1.3.1 Office
1.3.2 Study
1.3.3 Vehicle
1.3.4 Other
1.4 Market Analysis by Regions
1.4.1 North America (United States, Canada and Mexico)
1.4.1.1 United States Market States and Outlook (2013-2023)
1.4.1.2 Canada Market States and Outlook (2013-2023)
1.4.1.3 Mexico Market States and Outlook (2013-2023)
1.4.2 Europe (Germany, France, UK, Russia and Italy)
1.4.2.1 Germany Market States and Outlook (2013-2023)
1.4.2.2 France Market States and Outlook (2013-2023)
1.4.2.3 UK Market States and Outlook (2013-2023)
1.4.2.4 Russia Market States and Outlook (2013-2023)
1.4.2.5 Italy Market States and Outlook (2013-2023)
1.4.3 Asia-Pacific (China, Japan, Korea, India and Southeast Asia)
1.4.3.1 China Market States and Outlook (2013-2023)
1.4.3.2 Japan Market States and Outlook (2013-2023)
1.4.3.3 Korea Market States and Outlook (2013-2023)
1.4.3.4 India Market States and Outlook (2013-2023)
1.4.3.5 Southeast Asia Market States and Outlook (2013-2023)
1.4.4 South America, Middle East and Africa
1.4.4.1 Brazil Market States and Outlook (2013-2023)
1.4.4.2 Egypt Market States and Outlook (2013-2023)
1.4.4.3 Saudi Arabia Market States and Outlook (2013-2023)
1.4.4.4 South Africa Market States and Outlook (2013-2023)
1.4.4.5 Nigeria Market States and Outlook (2013-2023)
1.5 Market Dynamics
1.5.1 Market Opportunities
1.5.2 Market Risk
1.5.3 Market Driving Force
2 Manufacturers Profiles
2.1 Kingston
2.1.1 Business Overview
2.1.1.1 Kingston Description
2.1.1.2 Kingston Headquarter, Main Business and Finance Overview
2.1.2 Kingston Rotating U Disk Product Introduction
2.1.2.1 Rotating U Disk Production Bases, Sales Regions and Major Competitors
2.1.2.2 Rotating U Disk Product Information
2.1.3 Kingston Rotating U Disk Sales, Price, Revenue, Gross Margin and Market Share (2016-2017)
2.1.3.1 Kingston Rotating U Disk Sales, Price, Revenue, Gross Margin and Market Share (2016-2017)
2.1.3.2 Global Kingston Rotating U Disk Market Share in 2017
2.2 SanDisk
2.2.1 Business Overview
2.2.1.1 SanDisk Description
2.2.1.2 SanDisk Headquarter, Main Business and Finance Overview
2.2.2 SanDisk Rotating U Disk Product Introduction
2.2.2.1 Rotating U Disk Production Bases, Sales Regions and Major Competitors
2.2.2.2 Rotating U Disk Product Information
2.2.3 SanDisk Rotating U Disk Sales, Price, Revenue, Gross Margin and Market Share (2016-2017)
2.2.3.1 SanDisk Rotating U Disk Sales, Price, Revenue, Gross Margin and Market Share (2016-2017)
2.2.3.2 Global SanDisk Rotating U Disk Market Share in 2017
2.3 Teclast
2.3.1 Business Overview
2.3.1.1 Teclast Description
2.3.1.2 Teclast Headquarter, Main Business and Finance Overview
2.3.2 Teclast Rotating U Disk Product Introduction
2.3.2.1 Rotating U Disk Production Bases, Sales Regions and Major Competitors
2.3.2.2 Rotating U Disk Product Information
2.3.3 Teclast Rotating U Disk Sales, Price, Revenue, Gross Margin and Market Share (2016-2017)
2.3.3.1 Teclast Rotating U Disk Sales, Price, Revenue, Gross Margin and Market Share (2016-2017)
2.3.3.2 Global Teclast Rotating U Disk Market Share in 2017
2.4 Eaget
2.4.1 Business Overview
2.4.1.1 Eaget Description
2.4.1.2 Eaget Headquarter, Main Business and Finance Overview
2.4.2 Eaget Rotating U Disk Product Introduction
2.4.2.1 Rotating U Disk Production Bases, Sales Regions and Major Competitors
2.4.2.2 Rotating U Disk Product Information
2.4.3 Eaget Rotating U Disk Sales, Price, Revenue, Gross Margin and Market Share (2016-2017)
2.4.3.1 Eaget Rotating U Disk Sales, Price, Revenue, Gross Margin and Market Share (2016-2017)
2.4.3.2 Global Eaget Rotating U Disk Market Share in 2017
2.5 PNY
2.5.1 Business Overview
2.5.1.1 PNY Description
2.5.1.2 PNY Headquarter, Main Business and Finance Overview
2.5.2 PNY Rotating U Disk Product Introduction
2.5.2.1 Rotating U Disk Production Bases, Sales Regions and Major Competitors
2.5.2.2 Rotating U Disk Product Information
2.5.3 PNY Rotating U Disk Sales, Price, Revenue, Gross Margin and Market Share (2016-2017)
2.5.3.1 PNY Rotating U Disk Sales, Price, Revenue, Gross Margin and Market Share (2016-2017)
2.5.3.2 Global PNY Rotating U Disk Market Share in 2017
2.6 Lexar
2.6.1 Business Overview
2.6.1.1 Lexar Description
2.6.1.2 Lexar Headquarter, Main Business and Finance Overview
2.6.2 Lexar Rotating U Disk Product Introduction
2.6.2.1 Rotating U Disk Production Bases, Sales Regions and Major Competitors
2.6.2.2 Rotating U Disk Product Information
2.6.3 Lexar Rotating U Disk Sales, Price, Revenue, Gross Margin and Market Share (2016-2017)
2.6.3.1 Lexar Rotating U Disk Sales, Price, Revenue, Gross Margin and Market Share (2016-2017)
2.6.3.2 Global Lexar Rotating U Disk Market Share in 2017
2.7 Apacer
2.7.1 Business Overview
2.7.1.1 Apacer Description
2.7.1.2 Apacer Headquarter, Main Business and Finance Overview
2.7.2 Apacer Rotating U Disk Product Introduction
2.7.2.1 Rotating U Disk Production Bases, Sales Regions and Major Competitors
2.7.2.2 Rotating U Disk Product Information
2.7.3 Apacer Rotating U Disk Sales, Price, Revenue, Gross Margin and Market Share (2016-2017)
2.7.3.1 Apacer Rotating U Disk Sales, Price, Revenue, Gross Margin and Market Share (2016-2017)
2.7.3.2 Global Apacer Rotating U Disk Market Share in 2017
2.8 Netac
2.8.1 Business Overview
2.8.1.1 Netac Description
2.8.1.2 Netac Headquarter, Main Business and Finance Overview
2.8.2 Netac Rotating U Disk Product Introduction
2.8.2.1 Rotating U Disk Production Bases, Sales Regions and Major Competitors
2.8.2.2 Rotating U Disk Product Information
2.8.3 Netac Rotating U Disk Sales, Price, Revenue, Gross Margin and Market Share (2016-2017)
2.8.3.1 Netac Rotating U Disk Sales, Price, Revenue, Gross Margin and Market Share (2016-2017)
2.8.3.2 Global Netac Rotating U Disk Market Share in 2017
2.9 Aigo
2.9.1 Business Overview
2.9.1.1 Aigo Description
2.9.1.2 Aigo Headquarter, Main Business and Finance Overview
2.9.2 Aigo Rotating U Disk Product Introduction
2.9.2.1 Rotating U Disk Production Bases, Sales Regions and Major Competitors
2.9.2.2 Rotating U Disk Product Information
2.9.3 Aigo Rotating U Disk Sales, Price, Revenue, Gross Margin and Market Share (2016-2017)
2.9.3.1 Aigo Rotating U Disk Sales, Price, Revenue, Gross Margin and Market Share (2016-2017)
2.9.3.2 Global Aigo Rotating U Disk Market Share in 2017
2.10 Newsmy
2.10.1 Business Overview
2.10.1.1 Newsmy Description
2.10.1.2 Newsmy Headquarter, Main Business and Finance Overview
2.10.2 Newsmy Rotating U Disk Product Introduction
2.10.2.1 Rotating U Disk Production Bases, Sales Regions and Major Competitors
2.10.2.2 Rotating U Disk Product Information
2.10.3 Newsmy Rotating U Disk Sales, Price, Revenue, Gross Margin and Market Share (2016-2017)
2.10.3.1 Newsmy Rotating U Disk Sales, Price, Revenue, Gross Margin and Market Share (2016-2017)
2.10.3.2 Global Newsmy Rotating U Disk Market Share in 2017
3 Global Rotating U Disk Market Competition, by Manufacturer
3.1 Global Rotating U Disk Sales and Market Share by Manufacturer (2016-2017)
3.2 Global Rotating U Disk Revenue and Market Share by Manufacturer (2016-2017)
3.3 Global Rotating U Disk Price by Manufacturer (2016-2017)
3.4 Market Concentration Rate
3.4.1 Top 3 Rotating U Disk Manufacturer Market Share in 2017
3.4.2 Top 5 Rotating U Disk Manufacturer Market Share in 2017
3.5 Market Competition Trend
4 Global Rotating U Disk Market Analysis by Regions
4.1 Global Rotating U Disk Sales, Revenue and Market Share by Regions
4.1.1 Global Rotating U Disk Sales by Regions (2013-2018)
4.1.2 Global Rotating U Disk Revenue by Regions (2013-2018)
4.2 North America Rotating U Disk Sales, Revenue and Growth Rate (2013-2018)
4.3 Europe Rotating U Disk Sales, Revenue and Growth Rate (2013-2018)
4.4 Asia-Pacific Rotating U Disk Sales, Revenue and Growth Rate (2013-2018)
4.5 South America Rotating U Disk Sales, Revenue and Growth Rate (2013-2018)
4.6 Middle East and Africa Rotating U Disk Sales, Revenue and Growth Rate (2013-2018)
5 North America Rotating U Disk by Countries, Type, Application and Manufacturers
5.1 North America Rotating U Disk Sales, Revenue and Market Share by Countries
5.1.1 North America Rotating U Disk Sales by Countries (2013-2018)
5.1.2 North America Rotating U Disk Revenue by Countries (2013-2018)
5.1.3 United States Rotating U Disk Sales and Growth Rate (2013-2018)
5.1.4 Canada Rotating U Disk Sales and Growth Rate (2013-2018)
5.1.5 Mexico Rotating U Disk Sales and Growth Rate (2013-2018)
5.2 North America Rotating U Disk Sales and Revenue (Value) by Manufacturers (2016-2017)
5.2.1 North America Rotating U Disk Sales by Manufacturers (2016-2017)
5.2.2 North America Rotating U Disk Revenue by Manufacturers (2016-2017)
5.3 North America Rotating U Disk Sales, Revenue and Market Share by Type (2013-2018)
5.3.1 North America Rotating U Disk Sales and Sales Share by Type (2013-2018)
5.3.2 North America Rotating U Disk Revenue and Revenue Share by Type (2013-2018)
5.4 North America Rotating U Disk Sales, Revenue and Market Share by Application (2013-2018)
5.4.1 North America Rotating U Disk Sales and Sales Share by Application (2013-2018)
5.4.2 North America Rotating U Disk Revenue and Revenue Share by Application (2013-2018)
6 Europe Rotating U Disk by Countries, Type, Application and Manufacturers
6.1 Europe Rotating U Disk Sales, Revenue and Market Share by Countries
6.1.1 Europe Rotating U Disk Sales by Countries (2013-2018)
6.1.2 Europe Rotating U Disk Revenue by Countries (2013-2018)
6.1.3 Germany Rotating U Disk Sales and Growth Rate (2013-2018)
6.1.4 UK Rotating U Disk Sales and Growth Rate (2013-2018)
6.1.5 France Rotating U Disk Sales and Growth Rate (2013-2018)
6.1.6 Russia Rotating U Disk Sales and Growth Rate (2013-2018)
6.1.7 Italy Rotating U Disk Sales and Growth Rate (2013-2018)
6.2 Europe Rotating U Disk Sales and Revenue (Value) by Manufacturers (2016-2017)
6.2.1 Europe Rotating U Disk Sales by Manufacturers (2016-2017)
6.2.2 Europe Rotating U Disk Revenue by Manufacturers (2016-2017)
6.3 Europe Rotating U Disk Sales, Revenue and Market Share by Type (2013-2018)
6.3.1 Europe Rotating U Disk Sales and Sales Share by Type (2013-2018)
6.3.2 Europe Rotating U Disk Revenue and Revenue Share by Type (2013-2018)
6.4 Europe Rotating U Disk Sales, Revenue and Market Share by Application (2013-2018)
6.4.1 Europe Rotating U Disk Sales and Sales Share by Application (2013-2018)
6.4.2 Europe Rotating U Disk Revenue and Revenue Share by Application (2013-2018)
7 Asia-Pacific Rotating U Disk by Countries, Type, Application and Manufacturers
7.1 Asia-Pacific Rotating U Disk Sales, Revenue and Market Share by Countries
7.1.1 Asia-Pacific Rotating U Disk Sales by Countries (2013-2018)
7.1.2 Asia-Pacific Rotating U Disk Revenue by Countries (2013-2018)
7.1.3 China Rotating U Disk Sales and Growth Rate (2013-2018)
7.1.4 Japan Rotating U Disk Sales and Growth Rate (2013-2018)
7.1.5 Korea Rotating U Disk Sales and Growth Rate (2013-2018)
7.1.6 India Rotating U Disk Sales and Growth Rate (2013-2018)
7.1.7 Southeast Asia Rotating U Disk Sales and Growth Rate (2013-2018)
7.2 Asia-Pacific Rotating U Disk Sales and Revenue (Value) by Manufacturers (2016-2017)
7.2.1 Asia-Pacific Rotating U Disk Sales by Manufacturers (2016-2017)
7.2.2 Asia-Pacific Rotating U Disk Revenue by Manufacturers (2016-2017)
7.3 Asia-Pacific Rotating U Disk Sales, Revenue and Market Share by Type (2013-2018)
7.3.1 Asia-Pacific Rotating U Disk Sales and Sales Share by Type (2013-2018)
7.3.2 Asia-Pacific Rotating U Disk Revenue and Revenue Share by Type (2013-2018)
7.4 Asia-Pacific Rotating U Disk Sales, Revenue and Market Share by Application (2013-2018)
7.4.1 Asia-Pacific Rotating U Disk Sales and Sales Share by Application (2013-2018)
7.4.2 Asia-Pacific Rotating U Disk Revenue and Revenue Share by Application (2013-2018)
8 South America Rotating U Disk by Countries, Type, Application and Manufacturers
8.1 South America Rotating U Disk Sales, Revenue and Market Share by Countries
8.1.1 South America Rotating U Disk Sales by Countries (2013-2018)
8.1.2 South America Rotating U Disk Revenue by Countries (2013-2018)
8.1.3 Brazil Rotating U Disk Sales and Growth Rate (2013-2018)
8.1.4 Argentina Rotating U Disk Sales and Growth Rate (2013-2018)
8.1.5 Colombia Rotating U Disk Sales and Growth Rate (2013-2018)
8.2 South America Rotating U Disk Sales and Revenue (Value) by Manufacturers (2016-2017)
8.2.1 South America Rotating U Disk Sales by Manufacturers (2016-2017)
8.2.2 South America Rotating U Disk Revenue by Manufacturers (2016-2017)
8.3 South America Rotating U Disk Sales, Revenue and Market Share by Type (2013-2018)
8.3.1 South America Rotating U Disk Sales and Sales Share by Type (2013-2018)
8.3.2 South America Rotating U Disk Revenue and Revenue Share by Type (2013-2018)
8.4 South America Rotating U Disk Sales, Revenue and Market Share by Application (2013-2018)
8.4.1 South America Rotating U Disk Sales and Sales Share by Application (2013-2018)
8.4.2 South America Rotating U Disk Revenue and Revenue Share by Application (2013-2018)
9 Middle East and Africa Rotating U Disk by Countries, Type, Application and Manufacturers
9.1 Middle East and Africa Rotating U Disk Sales, Revenue and Market Share by Countries
9.1.1 Middle East and Africa Rotating U Disk Sales by Countries (2013-2018)
9.1.2 Middle East and Africa Rotating U Disk Revenue by Countries (2013-2018)
9.1.3 Saudi Arabia Rotating U Disk Sales and Growth Rate (2013-2018)
9.1.4 UAE Rotating U Disk Sales and Growth Rate (2013-2018)
9.1.5 Egypt Rotating U Disk Sales and Growth Rate (2013-2018)
9.1.6 Nigeria Rotating U Disk Sales and Growth Rate (2013-2018)
9.1.7 South Africa Rotating U Disk Sales and Growth Rate (2013-2018)
9.2 Middle East and Africa Rotating U Disk Sales and Revenue (Value) by Manufacturers (2016-2017)
9.2.1 Middle East and Africa Rotating U Disk Sales by Manufacturers (2016-2017)
9.2.2 Middle East and Africa Rotating U Disk Revenue by Manufacturers (2016-2017)
9.3 Middle East and Africa Rotating U Disk Sales, Revenue and Market Share by Type (2013-2018)
9.3.1 Middle East and Africa Rotating U Disk Sales and Sales Share by Type (2013-2018)
9.3.1 Middle East and Africa Rotating U Disk Revenue and Revenue Share by Type (2013-2018)
9.4 Middle East and Africa Rotating U Disk Sales, Revenue and Market Share by Application (2013-2018)
9.4.1 Middle East and Africa Rotating U Disk Sales and Sales Share by Application (2013-2018)
9.4.2 Middle East and Africa Rotating U Disk Revenue and Revenue Share by Application (2013-2018)
10 Global Rotating U Disk Market Segment by Type
10.1 Global Rotating U Disk Sales, Revenue and Market Share by Type (2013-2018)
10.1.1 Global Rotating U Disk Sales and Market Share by Type (2013-2018)
10.1.2 Global Rotating U Disk Revenue and Market Share by Type (2013-2018)
10.2 USB 2.0 Sales Growth and Price
10.2.1 Global USB 2.0 Sales Growth (2013-2018)
10.2.2 Global USB 2.0 Price (2013-2018)
10.3 USB 3.0 Sales Growth and Price
10.3.1 Global USB 3.0 Sales Growth (2013-2018)
10.3.2 Global USB 3.0 Price (2013-2018)
11 Global Rotating U Disk Market Segment by Application
11.1 Global Rotating U Disk Sales Market Share by Application (2013-2018)
11.2 Office Sales Growth (2013-2018)
11.3 Study Sales Growth (2013-2018)
11.4 Vehicle Sales Growth (2013-2018)
11.5 Other Sales Growth (2013-2018)
12 Rotating U Disk Market Forecast (2018-2023)
12.1 Global Rotating U Disk Sales, Revenue and Growth Rate (2018-2023)
12.2 Rotating U Disk Market Forecast by Regions (2018-2023)
12.2.1 North America Rotating U Disk Market Forecast (2018-2023)
12.2.2 Europe Rotating U Disk Market Forecast (2018-2023)
12.2.3 Asia-Pacific Rotating U Disk Market Forecast (2018-2023)
12.2.4 South America Rotating U Disk Market Forecast (2018-2023)
12.2.5 Middle East and Africa Rotating U Disk Market Forecast (2018-2023)
12.3 Rotating U Disk Market Forecast by Type (2018-2023)
12.3.1 Global Rotating U Disk Sales Forecast by Type (2018-2023)
12.3.2 Global Rotating U Disk Market Share Forecast by Type (2018-2023)
12.4 Rotating U Disk Market Forecast by Application (2018-2023)
12.4.1 Global Rotating U Disk Sales Forecast by Application (2018-2023)
12.4.2 Global Rotating U Disk Market Share Forecast by Application (2018-2023)
13 Sales Channel, Distributors, Traders and Dealers
13.1 Sales Channel
13.1.1 Direct Marketing
13.1.2 Indirect Marketing
13.1.3 Marketing Channel Future Trend
13.2 Distributors, Traders and Dealers
14 Research Findings and Conclusion
15 Appendix
15.1 Methodology
15.2 Data Source
List of Tables and Figures
Figure Rotating U Disk Picture
Table Product Specifications of Rotating U Disk
Figure Global Rotating U Disk CAGR (%), Y-o-Y Growth (&) and Market Size, 2013-2023 (USD Million)
Figure Global Rotating U Disk CAGR (%), Y-o-Y Growth (&) and Market Size, 2013-2023 (Sales)
Figure Global Sales Market Share of Rotating U Disk by Types in 2017
Figure USB 2.0 Picture
Table Major Manufacturers of USB 2.0
Figure USB 3.0 Picture
Table Major Manufacturers of USB 3.0
Figure Rotating U Disk Sales Market Share by Applications in 2017
Figure Office Picture
Figure Study Picture
Figure Vehicle Picture
Figure Other Picture
Figure United States Rotating U Disk Revenue (Value) and Growth Rate (2013-2023)
Figure Canada Rotating U Disk Revenue (Value) and Growth Rate (2013-2023)
Figure Mexico Rotating U Disk Revenue (Value) and Growth Rate (2013-2023)
Figure Germany Rotating U Disk Revenue (Value) and Growth Rate (2013-2023)
Figure France Rotating U Disk Revenue (Value) and Growth Rate (2013-2023)
Figure UK Rotating U Disk Revenue (Value) and Growth Rate (2013-2023)
Figure Russia Rotating U Disk Revenue (Value) and Growth Rate (2013-2023)
Figure Italy Rotating U Disk Revenue (Value) and Growth Rate (2013-2023)
Figure China Rotating U Disk Revenue (Value) and Growth Rate (2013-2023)
Figure Japan Rotating U Disk Revenue (Value) and Growth Rate (2013-2023)
Figure Korea Rotating U Disk Revenue (Value) and Growth Rate (2013-2023)
Figure India Rotating U Disk Revenue (Value) and Growth Rate (2013-2023)
Figure Southeast Asia Rotating U Disk Revenue (Value) and Growth Rate (2013-2023)
Figure Brazil Rotating U Disk Revenue (Value) and Growth Rate (2013-2023)
Figure Egypt Rotating U Disk Revenue (Value) and Growth Rate (2013-2023)
Figure Saudi Arabia Rotating U Disk Revenue (Value) and Growth Rate (2013-2023)
Figure South Africa Rotating U Disk Revenue (Value) and Growth Rate (2013-2023)
Figure Nigeria Rotating U Disk Revenue (Value) and Growth Rate (2013-2023)
Table Kingston Headquarter, Established, Main Business and Finance Overview (2017)
Table Kingston Rotating U Disk Production Bases, Sales Regions and Major Competitors
Table Kingston Rotating U Disk Product
Table Kingston Rotating U Disk Sales, Price, Revenue, Gross Margin and Market Share (2016-2017)
Figure Global Kingston Rotating U Disk Sales Market Share in 2017
Figure Global Kingston Rotating U Disk Revenue Market Share in 2017
Table SanDisk Headquarter, Established, Main Business and Finance Overview (2017)
Table SanDisk Rotating U Disk Production Bases, Sales Regions and Major Competitors
Table SanDisk Rotating U Disk Product
Table SanDisk Rotating U Disk Sales, Price, Revenue, Gross Margin and Market Share (2016-2017)
Figure Global SanDisk Rotating U Disk Sales Market Share in 2017
Figure Global SanDisk Rotating U Disk Revenue Market Share in 2017
Table Teclast Headquarter, Established, Main Business and Finance Overview (2017)
Table Teclast Rotating U Disk Production Bases, Sales Regions and Major Competitors
Table Teclast Rotating U Disk Product
Table Teclast Rotating U Disk Sales, Price, Revenue, Gross Margin and Market Share (2016-2017)
Figure Global Teclast Rotating U Disk Sales Market Share in 2017
Figure Global Teclast Rotating U Disk Revenue Market Share in 2017
Table Eaget Headquarter, Established, Main Business and Finance Overview (2017)
Table Eaget Rotating U Disk Production Bases, Sales Regions and Major Competitors
Table Eaget Rotating U Disk Product
Table Eaget Rotating U Disk Sales, Price, Revenue, Gross Margin and Market Share (2016-2017)
Figure Global Eaget Rotating U Disk Sales Market Share in 2017
Figure Global Eaget Rotating U Disk Revenue Market Share in 2017
Table PNY Headquarter, Established, Main Business and Finance Overview (2017)
Table PNY Rotating U Disk Production Bases, Sales Regions and Major Competitors
Table PNY Rotating U Disk Product
Table PNY Rotating U Disk Sales, Price, Revenue, Gross Margin and Market Share (2016-2017)
Figure Global PNY Rotating U Disk Sales Market Share in 2017
Figure Global PNY Rotating U Disk Revenue Market Share in 2017
Table Lexar Headquarter, Established, Main Business and Finance Overview (2017)
Table Lexar Rotating U Disk Production Bases, Sales Regions and Major Competitors
Table Lexar Rotating U Disk Product
Table Lexar Rotating U Disk Sales, Price, Revenue, Gross Margin and Market Share (2016-2017)
Figure Global Lexar Rotating U Disk Sales Market Share in 2017
Figure Global Lexar Rotating U Disk Revenue Market Share in 2017
Table Apacer Headquarter, Established, Main Business and Finance Overview (2017)
Table Apacer Rotating U Disk Production Bases, Sales Regions and Major Competitors
Table Apacer Rotating U Disk Product
Table Apacer Rotating U Disk Sales, Price, Revenue, Gross Margin and Market Share (2016-2017)
Figure Global Apacer Rotating U Disk Sales Market Share in 2017
Figure Global Apacer Rotating U Disk Revenue Market Share in 2017
Table Netac Headquarter, Established, Main Business and Finance Overview (2017)
Table Netac Rotating U Disk Production Bases, Sales Regions and Major Competitors
Table Netac Rotating U Disk Product
Table Netac Rotating U Disk Sales, Price, Revenue, Gross Margin and Market Share (2016-2017)
Figure Global Netac Rotating U Disk Sales Market Share in 2017
Figure Global Netac Rotating U Disk Revenue Market Share in 2017
Table Aigo Headquarter, Established, Main Business and Finance Overview (2017)
Table Aigo Rotating U Disk Production Bases, Sales Regions and Major Competitors
Table Aigo Rotating U Disk Product
Table Aigo Rotating U Disk Sales, Price, Revenue, Gross Margin and Market Share (2016-2017)
Figure Global Aigo Rotating U Disk Sales Market Share in 2017
Figure Global Aigo Rotating U Disk Revenue Market Share in 2017
Table Newsmy Headquarter, Established, Main Business and Finance Overview (2017)
Table Newsmy Rotating U Disk Production Bases, Sales Regions and Major Competitors
Table Newsmy Rotating U Disk Product
Table Newsmy Rotating U Disk Sales, Price, Revenue, Gross Margin and Market Share (2016-2017)
Figure Global Newsmy Rotating U Disk Sales Market Share in 2017
Figure Global Newsmy Rotating U Disk Revenue Market Share in 2017
Table Global Rotating U Disk Sales by Manufacturer (2016-2017)
Figure Global Rotating U Disk Sales Market Share by Manufacturer in 2016
Figure Global Rotating U Disk Sales Market Share by Manufacturer in 2017
Table Global Rotating U Disk Revenue by Manufacturer (2016-2017)
Figure Global Rotating U Disk Revenue Market Share by Manufacturer in 2016
Figure Global Rotating U Disk Revenue Market Share by Manufacturer in 2017
Table Global Rotating U Disk Price by Manufacturer (2016-2017)
Figure Top 3 Rotating U Disk Manufacturer (Revenue) Market Share in 2017
Figure Top 6 Rotating U Disk Manufacturer (Revenue) Market Share in 2017
Figure Global Rotating U Disk Sales and Growth Rate (2013-2018)
Figure Global Rotating U Disk Revenue and Growth Rate (2013-2018)
Table Global Rotating U Disk Sales by Regions (2013-2018)
Table Global Rotating U Disk Sales Market Share by Regions (2013-2018)
Table Global Rotating U Disk Revenue by Regions (2013-2018)
Figure Global Rotating U Disk Revenue Market Share by Regions in 2013
Figure Global Rotating U Disk Revenue Market Share by Regions in 2017
Figure North America Rotating U Disk Sales and Growth Rate (2013-2018)
Figure North America Rotating U Disk Revenue and Growth Rate (2013-2018)
Figure Europe Rotating U Disk Sales and Growth Rate (2013-2018)
Figure Europe Rotating U Disk Revenue and Growth Rate (2013-2018)
Figure Asia-Pacific Rotating U Disk Sales and Growth Rate (2013-2018)
Figure Asia-Pacific Rotating U Disk Revenue and Growth Rate (2013-2018)
Figure South America Rotating U Disk Sales and Growth Rate (2013-2018)
Figure South America Rotating U Disk Revenue and Growth Rate (2013-2018)
Figure Middle East and Africa Rotating U Disk Sales and Growth Rate (2013-2018)
Figure Middle East and Africa Rotating U Disk Revenue and Growth Rate (2013-2018)
Figure North America Rotating U Disk Revenue and Growth Rate (2013-2018)
Table North America Rotating U Disk Sales by Countries (2013-2018)
Table North America Rotating U Disk Sales Market Share by Countries (2013-2018)
Figure North America Rotating U Disk Sales Market Share by Countries in 2013
Figure North America Rotating U Disk Sales Market Share by Countries in 2017
Table North America Rotating U Disk Revenue by Countries (2013-2018)
Table North America Rotating U Disk Revenue Market Share by Countries (2013-2018)
Figure North America Rotating U Disk Revenue Market Share by Countries in 2013
Figure North America Rotating U Disk Revenue Market Share by Countries in 2017
Figure United States Rotating U Disk Sales and Growth Rate (2013-2018)
Figure Canada Rotating U Disk Sales and Growth Rate (2013-2018)
Figure Mexico Rotating U Disk Sales and Growth Rate (2013-2018)
Table North America Rotating U Disk Sales by Manufacturer (2016-2017)
Figure North America Rotating U Disk Sales Market Share by Manufacturer in 2016
Figure North America Rotating U Disk Sales Market Share by Manufacturer in 2017
Table North America Rotating U Disk Revenue by Manufacturer (2016-2017)
Figure North America Rotating U Disk Revenue Market Share by Manufacturer in 2016
Figure North America Rotating U Disk Revenue Market Share by Manufacturer in 2017
Table North America Rotating U Disk Sales by Type (2013-2018)
Table North America Rotating U Disk Sales Share by Type (2013-2018)
Table North America Rotating U Disk Revenue by Type (2013-2018)
Table North America Rotating U Disk Revenue Share by Type (2013-2018)
Table North America Rotating U Disk Sales by Application (2013-2018)
Table North America Rotating U Disk Sales Share by Application (2013-2018)
Table North America Rotating U Disk Revenue by Application (2013-2018)
Table North America Rotating U Disk Revenue Share by Application (2013-2018)
Figure Europe Rotating U Disk Revenue and Growth Rate (2013-2018)
Table Europe Rotating U Disk Sales by Countries (2013-2018)
Table Europe Rotating U Disk Sales Market Share by Countries (2013-2018)
Table Europe Rotating U Disk Revenue by Countries (2013-2018)
Figure Europe Rotating U Disk Revenue Market Share by Countries in 2016
Figure Europe Rotating U Disk Revenue Market Share by Countries in 2017
Figure Germany Rotating U Disk Sales and Growth Rate (2013-2018)
Figure UK Rotating U Disk Sales and Growth Rate (2013-2018)
Figure France Rotating U Disk Sales and Growth Rate (2013-2018)
Figure Russia Rotating U Disk Sales and Growth Rate (2013-2018)
Figure Italy Rotating U Disk Sales and Growth Rate (2013-2018)
Table Europe Rotating U Disk Sales by Manufacturer (2016-2017)
Figure Europe Rotating U Disk Sales Market Share by Manufacturer in 2016
Figure Europe Rotating U Disk Sales Market Share by Manufacturer in 2017
Table Europe Rotating U Disk Revenue by Manufacturer (2016-2017)
Figure Europe Rotating U Disk Revenue Market Share by Manufacturer in 2016
Figure Europe Rotating U Disk Revenue Market Share by Manufacturer in 2017
Table Europe Rotating U Disk Sales by Type (2013-2018)
Table Europe Rotating U Disk Sales Share by Type (2013-2018)
Table Europe Rotating U Disk Revenue by Type (2013-2018)
Table Europe Rotating U Disk Revenue Share by Type (2013-2018)
Table Europe Rotating U Disk Sales by Application (2013-2018)
Table Europe Rotating U Disk Sales Share by Application (2013-2018)
Table Europe Rotating U Disk Revenue by Application (2013-2018)
Table Europe Rotating U Disk Revenue Share by Application (2013-2018)
Figure Asia-Pacific Rotating U Disk Revenue and Growth Rate (2013-2018)
Table Asia-Pacific Rotating U Disk Sales by Countries (2013-2018)
Table Asia-Pacific Rotating U Disk Sales Market Share by Countries (2013-2018)
Figure Asia-Pacific Rotating U Disk Sales Market Share by Countries 2017
Table Asia-Pacific Rotating U Disk Revenue by Countries (2013-2018)
Figure Asia-Pacific Rotating U Disk Revenue Market Share by Countries 2017
Figure China Rotating U Disk Sales and Growth Rate (2013-2018)
Figure Japan Rotating U Disk Sales and Growth Rate (2013-2018)
Figure Korea Rotating U Disk Sales and Growth Rate (2013-2018)
Figure India Rotating U Disk Sales and Growth Rate (2013-2018)
Figure Southeast Asia Rotating U Disk Sales and Growth Rate (2013-2018)
Table Asia-Pacific Rotating U Disk Sales by Manufacturer (2016-2017)
Figure Asia-Pacific Rotating U Disk Sales Market Share by Manufacturer in 2016
Figure Asia-Pacific Rotating U Disk Sales Market Share by Manufacturer in 2017
Table Asia-Pacific Rotating U Disk Revenue by Manufacturer (2016-2017)
Figure Asia-Pacific Rotating U Disk Revenue Market Share by Manufacturer in 2016
Figure Asia-Pacific Rotating U Disk Revenue Market Share by Manufacturer in 2017
Table Asia-Pacific Rotating U Disk Sales by Type (2013-2018)
Table Asia-Pacific Rotating U Disk Sales Share by Type (2013-2018)
Table Asia-Pacific Rotating U Disk Revenue by Type (2013-2018)
Table Asia-Pacific Rotating U Disk Revenue Share by Type (2013-2018)
Table Asia-Pacific Rotating U Disk Sales by Application (2013-2018)
Table Asia-Pacific Rotating U Disk Sales Share by Application (2013-2018)
Table Asia-Pacific Rotating U Disk Revenue by Application (2013-2018)
Table Asia-Pacific Rotating U Disk Revenue Share by Application (2013-2018)
Figure South America Rotating U Disk Revenue and Growth Rate (2013-2018)
Table South America Rotating U Disk Sales by Countries (2013-2018)
Table South America Rotating U Disk Sales Market Share by Countries (2013-2018)
Figure South America Rotating U Disk Sales Market Share by Countries in 2017
Table South America Rotating U Disk Revenue by Countries (2013-2018)
Table South America Rotating U Disk Revenue Market Share by Countries (2013-2018)
Figure South America Rotating U Disk Revenue Market Share by Countries in 2017
Figure Brazil Rotating U Disk Sales and Growth Rate (2013-2018)
Figure Argentina Rotating U Disk Sales and Growth Rate (2013-2018)
Figure Colombia Rotating U Disk Sales and Growth Rate (2013-2018)
Table South America Rotating U Disk Sales by Manufacturer (2016-2017)
Figure South America Rotating U Disk Sales Market Share by Manufacturer in 2016
Figure South America Rotating U Disk Sales Market Share by Manufacturer in 2017
Table South America Rotating U Disk Revenue by Manufacturer (2016-2017)
Figure South America Rotating U Disk Revenue Market Share by Manufacturer in 2016
Figure South America Rotating U Disk Revenue Market Share by Manufacturer in 2017
Table South America Rotating U Disk Sales by Type (2013-2018)
Table South America Rotating U Disk Sales Share by Type (2013-2018)
Table South America Rotating U Disk Revenue by Type (2013-2018)
Table South America Rotating U Disk Revenue Share by Type (2013-2018)
Table South America Rotating U Disk Sales by Application (2013-2018)
Table South America Rotating U Disk Sales Share by Application (2013-2018)
Table South America Rotating U Disk Revenue by Application (2013-2018)
Table South America Rotating U Disk Revenue Share by Application (2013-2018)
Figure Middle East and Africa Rotating U Disk Revenue and Growth Rate (2013-2018)
Table Middle East and Africa Rotating U Disk Sales by Countries (2013-2018)
Table Middle East and Africa Rotating U Disk Sales Market Share by Countries (2013-2018)
Figure Middle East and Africa Rotating U Disk Sales Market Share by Countries in 2017
Table Middle East and Africa Rotating U Disk Revenue by Countries (2013-2018)
Table Middle East and Africa Rotating U Disk Revenue Market Share by Countries (2013-2018)
Figure Middle East and Africa Rotating U Disk Revenue Market Share by Countries in 2013
Figure Middle East and Africa Rotating U Disk Revenue Market Share by Countries in 2017
Figure Saudi Arabia Rotating U Disk Sales and Growth Rate (2013-2018)
Figure UAE Rotating U Disk Sales and Growth Rate (2013-2018)
Figure Egypt Rotating U Disk Sales and Growth Rate (2013-2018)
Figure Nigeria Rotating U Disk Sales and Growth Rate (2013-2018)
Figure South Africa Rotating U Disk Sales and Growth Rate (2013-2018)
Table Middle East and Africa Rotating U Disk Sales by Manufacturer (2016-2017)
Figure Middle East and Africa Rotating U Disk Sales Market Share by Manufacturer in 2016
Figure Middle East and Africa Rotating U Disk Sales Market Share by Manufacturer in 2017
Table Middle East and Africa Rotating U Disk Revenue by Manufacturer (2016-2017)
Figure Middle East and Africa Rotating U Disk Revenue Market Share by Manufacturer in 2016
Figure Middle East and Africa Rotating U Disk Revenue Market Share by Manufacturer in 2017
Table Middle East and Africa Rotating U Disk Sales by Type (2013-2018)
Table Middle East and Africa Rotating U Disk Sales Share by Type (2013-2018)
Table Middle East and Africa Rotating U Disk Revenue by Type (2013-2018)
Table Middle East and Africa Rotating U Disk Revenue Share by Type (2013-2018)
Table Middle East and Africa Rotating U Disk Sales by Application (2013-2018)
Table Middle East and Africa Rotating U Disk Sales Share by Application (2013-2018)
Table Middle East and Africa Rotating U Disk Revenue by Application (2013-2018)
Table Middle East and Africa Rotating U Disk Revenue Share by Application (2013-2018)
Table Global Rotating U Disk Sales by Type (2013-2018)
Table Global Rotating U Disk Sales Share by Type (2013-2018)
Table Global Rotating U Disk Revenue by Type (2013-2018)
Table Global Rotating U Disk Revenue Share by Type (2013-2018)
Figure Global USB 2.0 Sales Growth (2013-2018)
Figure Global USB 2.0 Price (2013-2018)
Figure Global USB 3.0 Sales Growth (2013-2018)
Figure Global USB 3.0 Price (2013-2018)
Table Global Rotating U Disk Sales by Application (2013-2018)
Table Global Rotating U Disk Sales Share by Application (2013-2018)
Figure Global Office Sales Growth (2013-2018)
Figure Global Study Sales Growth (2013-2018)
Figure Global Vehicle Sales Growth (2013-2018)
Figure Global Other Sales Growth (2013-2018)
Figure Global Rotating U Disk Sales, Revenue and Growth Rate (2018-2023)
Table Global Rotating U Disk Sales Forecast by Regions (2018-2023)
Table Global Rotating U Disk Market Share Forecast by Regions (2018-2023)
Figure North America Sales Rotating U Disk Market Forecast (2018-2023)
Figure Europe Sales Rotating U Disk Market Forecast (2018-2023)
Figure Asia-Pacific Sales Rotating U Disk Market Forecast (2018-2023)
Figure South America Sales Rotating U Disk Market Forecast (2018-2023)
Figure Middle East and Africa Sales Rotating U Disk Market Forecast (2018-2023)
Table Global Rotating U Disk Sales Forecast by Type (2018-2023)
Table Global Rotating U Disk Market Share Forecast by Type (2018-2023)
Table Global Rotating U Disk Sales Forecast by Application (2018-2023)
Table Global Rotating U Disk Market Share Forecast by Application (2018-2023)
Table Distributors/Traders/ Dealers List
Kingston
SanDisk
Teclast
Eaget
PNY
Lexar
Apacer
Netac
Aigo
Newsmy
*If Applicable.
Links
[1] https://www.marketresearchreports.com/countries/global[2] https://www.marketresearchreports.com/computing-electronics[3] https://www.marketresearchreports.com/country-overview-computing-electronics[4] https://www.marketresearchreports.com/electrical-components[5] https://www.marketresearchreports.com/electrical-products