
The worldwide market for Active, Smart, and Intelligent Packaging is expected to grow at a CAGR of roughly 8.6% over the next five years, will reach 26400 million US$ in 2023, from 16100 million US$ in 2017, according to a new study.
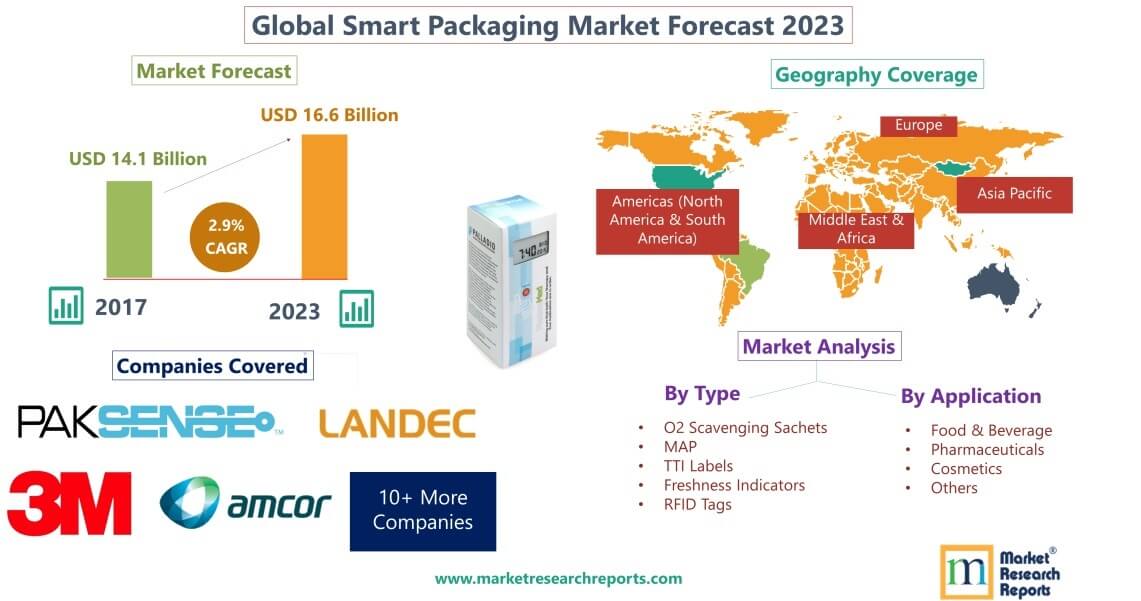
Table of Contents
1 Market Overview
1.1 Active, Smart, and Intelligent Packaging Introduction
1.2 Market Analysis by Type
1.2.1 O2 Scavenging Sachets
1.2.2 MAP
1.2.3 TTI Labels
1.2.4 Freshness Indicators
1.2.5 RFID Tags
1.3 Market Analysis by Applications
1.3.1 Food & Beverage
1.3.2 Pharmaceuticals
1.3.3 Cosmetics
1.3.4 Others
1.4 Market Analysis by Regions
1.4.1 North America (United States, Canada and Mexico)
1.4.1.1 United States Market States and Outlook (2013-2023)
1.4.1.2 Canada Market States and Outlook (2013-2023)
1.4.1.3 Mexico Market States and Outlook (2013-2023)
1.4.2 Europe (Germany, France, UK, Russia and Italy)
1.4.2.1 Germany Market States and Outlook (2013-2023)
1.4.2.2 France Market States and Outlook (2013-2023)
1.4.2.3 UK Market States and Outlook (2013-2023)
1.4.2.4 Russia Market States and Outlook (2013-2023)
1.4.2.5 Italy Market States and Outlook (2013-2023)
1.4.3 Asia-Pacific (China, Japan, Korea, India and Southeast Asia)
1.4.3.1 China Market States and Outlook (2013-2023)
1.4.3.2 Japan Market States and Outlook (2013-2023)
1.4.3.3 Korea Market States and Outlook (2013-2023)
1.4.3.4 India Market States and Outlook (2013-2023)
1.4.3.5 Southeast Asia Market States and Outlook (2013-2023)
1.4.4 South America, Middle East and Africa
1.4.4.1 Brazil Market States and Outlook (2013-2023)
1.4.4.2 Egypt Market States and Outlook (2013-2023)
1.4.4.3 Saudi Arabia Market States and Outlook (2013-2023)
1.4.4.4 South Africa Market States and Outlook (2013-2023)
1.4.4.5 Nigeria Market States and Outlook (2013-2023)
1.5 Market Dynamics
1.5.1 Market Opportunities
1.5.2 Market Risk
1.5.3 Market Driving Force
2 Manufacturers Profiles
2.1 PakSense
2.1.1 Business Overview
2.1.1.1 PakSense Description
2.1.1.2 PakSense Headquarter, Main Business and Finance Overview
2.1.2 PakSense Active, Smart, and Intelligent Packaging Product Introduction
2.1.2.1 Active, Smart, and Intelligent Packaging Production Bases, Sales Regions and Major Competitors
2.1.2.2 Active, Smart, and Intelligent Packaging Product Information
2.1.3 PakSense Active, Smart, and Intelligent Packaging Sales, Price, Revenue, Gross Margin and Market Share (2016-2017)
2.1.3.1 PakSense Active, Smart, and Intelligent Packaging Sales, Price, Revenue, Gross Margin and Market Share (2016-2017)
2.1.3.2 Global PakSense Active, Smart, and Intelligent Packaging Market Share in 2017
2.2 Landec
2.2.1 Business Overview
2.2.1.1 Landec Description
2.2.1.2 Landec Headquarter, Main Business and Finance Overview
2.2.2 Landec Active, Smart, and Intelligent Packaging Product Introduction
2.2.2.1 Active, Smart, and Intelligent Packaging Production Bases, Sales Regions and Major Competitors
2.2.2.2 Active, Smart, and Intelligent Packaging Product Information
2.2.3 Landec Active, Smart, and Intelligent Packaging Sales, Price, Revenue, Gross Margin and Market Share (2016-2017)
2.2.3.1 Landec Active, Smart, and Intelligent Packaging Sales, Price, Revenue, Gross Margin and Market Share (2016-2017)
2.2.3.2 Global Landec Active, Smart, and Intelligent Packaging Market Share in 2017
2.3 Sealed Air
2.3.1 Business Overview
2.3.1.1 Sealed Air Description
2.3.1.2 Sealed Air Headquarter, Main Business and Finance Overview
2.3.2 Sealed Air Active, Smart, and Intelligent Packaging Product Introduction
2.3.2.1 Active, Smart, and Intelligent Packaging Production Bases, Sales Regions and Major Competitors
2.3.2.2 Active, Smart, and Intelligent Packaging Product Information
2.3.3 Sealed Air Active, Smart, and Intelligent Packaging Sales, Price, Revenue, Gross Margin and Market Share (2016-2017)
2.3.3.1 Sealed Air Active, Smart, and Intelligent Packaging Sales, Price, Revenue, Gross Margin and Market Share (2016-2017)
2.3.3.2 Global Sealed Air Active, Smart, and Intelligent Packaging Market Share in 2017
2.4 Bemis
2.4.1 Business Overview
2.4.1.1 Bemis Description
2.4.1.2 Bemis Headquarter, Main Business and Finance Overview
2.4.2 Bemis Active, Smart, and Intelligent Packaging Product Introduction
2.4.2.1 Active, Smart, and Intelligent Packaging Production Bases, Sales Regions and Major Competitors
2.4.2.2 Active, Smart, and Intelligent Packaging Product Information
2.4.3 Bemis Active, Smart, and Intelligent Packaging Sales, Price, Revenue, Gross Margin and Market Share (2016-2017)
2.4.3.1 Bemis Active, Smart, and Intelligent Packaging Sales, Price, Revenue, Gross Margin and Market Share (2016-2017)
2.4.3.2 Global Bemis Active, Smart, and Intelligent Packaging Market Share in 2017
2.5 Crown
2.5.1 Business Overview
2.5.1.1 Crown Description
2.5.1.2 Crown Headquarter, Main Business and Finance Overview
2.5.2 Crown Active, Smart, and Intelligent Packaging Product Introduction
2.5.2.1 Active, Smart, and Intelligent Packaging Production Bases, Sales Regions and Major Competitors
2.5.2.2 Active, Smart, and Intelligent Packaging Product Information
2.5.3 Crown Active, Smart, and Intelligent Packaging Sales, Price, Revenue, Gross Margin and Market Share (2016-2017)
2.5.3.1 Crown Active, Smart, and Intelligent Packaging Sales, Price, Revenue, Gross Margin and Market Share (2016-2017)
2.5.3.2 Global Crown Active, Smart, and Intelligent Packaging Market Share in 2017
2.6 Amcor
2.6.1 Business Overview
2.6.1.1 Amcor Description
2.6.1.2 Amcor Headquarter, Main Business and Finance Overview
2.6.2 Amcor Active, Smart, and Intelligent Packaging Product Introduction
2.6.2.1 Active, Smart, and Intelligent Packaging Production Bases, Sales Regions and Major Competitors
2.6.2.2 Active, Smart, and Intelligent Packaging Product Information
2.6.3 Amcor Active, Smart, and Intelligent Packaging Sales, Price, Revenue, Gross Margin and Market Share (2016-2017)
2.6.3.1 Amcor Active, Smart, and Intelligent Packaging Sales, Price, Revenue, Gross Margin and Market Share (2016-2017)
2.6.3.2 Global Amcor Active, Smart, and Intelligent Packaging Market Share in 2017
2.7 3M
2.7.1 Business Overview
2.7.1.1 3M Description
2.7.1.2 3M Headquarter, Main Business and Finance Overview
2.7.2 3M Active, Smart, and Intelligent Packaging Product Introduction
2.7.2.1 Active, Smart, and Intelligent Packaging Production Bases, Sales Regions and Major Competitors
2.7.2.2 Active, Smart, and Intelligent Packaging Product Information
2.7.3 3M Active, Smart, and Intelligent Packaging Sales, Price, Revenue, Gross Margin and Market Share (2016-2017)
2.7.3.1 3M Active, Smart, and Intelligent Packaging Sales, Price, Revenue, Gross Margin and Market Share (2016-2017)
2.7.3.2 Global 3M Active, Smart, and Intelligent Packaging Market Share in 2017
2.8 Timestrip
2.8.1 Business Overview
2.8.1.1 Timestrip Description
2.8.1.2 Timestrip Headquarter, Main Business and Finance Overview
2.8.2 Timestrip Active, Smart, and Intelligent Packaging Product Introduction
2.8.2.1 Active, Smart, and Intelligent Packaging Production Bases, Sales Regions and Major Competitors
2.8.2.2 Active, Smart, and Intelligent Packaging Product Information
2.8.3 Timestrip Active, Smart, and Intelligent Packaging Sales, Price, Revenue, Gross Margin and Market Share (2016-2017)
2.8.3.1 Timestrip Active, Smart, and Intelligent Packaging Sales, Price, Revenue, Gross Margin and Market Share (2016-2017)
2.8.3.2 Global Timestrip Active, Smart, and Intelligent Packaging Market Share in 2017
2.9 Cryolog
2.9.1 Business Overview
2.9.1.1 Cryolog Description
2.9.1.2 Cryolog Headquarter, Main Business and Finance Overview
2.9.2 Cryolog Active, Smart, and Intelligent Packaging Product Introduction
2.9.2.1 Active, Smart, and Intelligent Packaging Production Bases, Sales Regions and Major Competitors
2.9.2.2 Active, Smart, and Intelligent Packaging Product Information
2.9.3 Cryolog Active, Smart, and Intelligent Packaging Sales, Price, Revenue, Gross Margin and Market Share (2016-2017)
2.9.3.1 Cryolog Active, Smart, and Intelligent Packaging Sales, Price, Revenue, Gross Margin and Market Share (2016-2017)
2.9.3.2 Global Cryolog Active, Smart, and Intelligent Packaging Market Share in 2017
2.10 Vitsab International
2.10.1 Business Overview
2.10.1.1 Vitsab International Description
2.10.1.2 Vitsab International Headquarter, Main Business and Finance Overview
2.10.2 Vitsab International Active, Smart, and Intelligent Packaging Product Introduction
2.10.2.1 Active, Smart, and Intelligent Packaging Production Bases, Sales Regions and Major Competitors
2.10.2.2 Active, Smart, and Intelligent Packaging Product Information
2.10.3 Vitsab International Active, Smart, and Intelligent Packaging Sales, Price, Revenue, Gross Margin and Market Share (2016-2017)
2.10.3.1 Vitsab International Active, Smart, and Intelligent Packaging Sales, Price, Revenue, Gross Margin and Market Share (2016-2017)
2.10.3.2 Global Vitsab International Active, Smart, and Intelligent Packaging Market Share in 2017
2.11 Varcode
2.11.1 Business Overview
2.11.2 Varcode Active, Smart, and Intelligent Packaging Product Introduction
2.11.3 Varcode Active, Smart, and Intelligent Packaging Sales, Price, Revenue, Gross Margin and Market Share (2016-2017)
2.12 LCR Hallcrest
2.12.1 Business Overview
2.12.2 LCR Hallcrest Active, Smart, and Intelligent Packaging Product Introduction
2.12.3 LCR Hallcrest Active, Smart, and Intelligent Packaging Sales, Price, Revenue, Gross Margin and Market Share (2016-2017)
2.13 Thin Film Electronics
2.13.1 Business Overview
2.13.2 Thin Film Electronics Active, Smart, and Intelligent Packaging Product Introduction
2.13.3 Thin Film Electronics Active, Smart, and Intelligent Packaging Sales, Price, Revenue, Gross Margin and Market Share (2016-2017)
2.14 CCL
2.14.1 Business Overview
2.14.2 CCL Active, Smart, and Intelligent Packaging Product Introduction
2.14.3 CCL Active, Smart, and Intelligent Packaging Sales, Price, Revenue, Gross Margin and Market Share (2016-2017)
2.15 Temptime
2.15.1 Business Overview
2.15.2 Temptime Active, Smart, and Intelligent Packaging Product Introduction
2.15.3 Temptime Active, Smart, and Intelligent Packaging Sales, Price, Revenue, Gross Margin and Market Share (2016-2017)
2.16 Multisorb Technologies
2.16.1 Business Overview
2.16.2 Multisorb Technologies Active, Smart, and Intelligent Packaging Product Introduction
2.16.3 Multisorb Technologies Active, Smart, and Intelligent Packaging Sales, Price, Revenue, Gross Margin and Market Share (2016-2017)
2.17 Coveris
2.17.1 Business Overview
2.17.2 Coveris Active, Smart, and Intelligent Packaging Product Introduction
2.17.3 Coveris Active, Smart, and Intelligent Packaging Sales, Price, Revenue, Gross Margin and Market Share (2016-2017)
3 Global Active, Smart, and Intelligent Packaging Market Competition, by Manufacturer
3.1 Global Active, Smart, and Intelligent Packaging Sales and Market Share by Manufacturer (2016-2017)
3.2 Global Active, Smart, and Intelligent Packaging Revenue and Market Share by Manufacturer (2016-2017)
3.3 Global Active, Smart, and Intelligent Packaging Price by Manufacturer (2016-2017)
3.4 Market Concentration Rate
3.4.1 Top 3 Active, Smart, and Intelligent Packaging Manufacturer Market Share in 2017
3.4.2 Top 5 Active, Smart, and Intelligent Packaging Manufacturer Market Share in 2017
3.5 Market Competition Trend
4 Global Active, Smart, and Intelligent Packaging Market Analysis by Regions
4.1 Global Active, Smart, and Intelligent Packaging Sales, Revenue and Market Share by Regions
4.1.1 Global Active, Smart, and Intelligent Packaging Sales by Regions (2013-2018)
4.1.2 Global Active, Smart, and Intelligent Packaging Revenue by Regions (2013-2018)
4.2 North America Active, Smart, and Intelligent Packaging Sales, Revenue and Growth Rate (2013-2018)
4.3 Europe Active, Smart, and Intelligent Packaging Sales, Revenue and Growth Rate (2013-2018)
4.4 Asia-Pacific Active, Smart, and Intelligent Packaging Sales, Revenue and Growth Rate (2013-2018)
4.5 South America Active, Smart, and Intelligent Packaging Sales, Revenue and Growth Rate (2013-2018)
4.6 Middle East and Africa Active, Smart, and Intelligent Packaging Sales, Revenue and Growth Rate (2013-2018)
5 North America Active, Smart, and Intelligent Packaging by Countries, Type, Application and Manufacturers
5.1 North America Active, Smart, and Intelligent Packaging Sales, Revenue and Market Share by Countries
5.1.1 North America Active, Smart, and Intelligent Packaging Sales by Countries (2013-2018)
5.1.2 North America Active, Smart, and Intelligent Packaging Revenue by Countries (2013-2018)
5.1.3 United States Active, Smart, and Intelligent Packaging Sales and Growth Rate (2013-2018)
5.1.4 Canada Active, Smart, and Intelligent Packaging Sales and Growth Rate (2013-2018)
5.1.5 Mexico Active, Smart, and Intelligent Packaging Sales and Growth Rate (2013-2018)
5.2 North America Active, Smart, and Intelligent Packaging Sales and Revenue (Value) by Manufacturers (2016-2017)
5.2.1 North America Active, Smart, and Intelligent Packaging Sales by Manufacturers (2016-2017)
5.2.2 North America Active, Smart, and Intelligent Packaging Revenue by Manufacturers (2016-2017)
5.3 North America Active, Smart, and Intelligent Packaging Sales, Revenue and Market Share by Type (2013-2018)
5.3.1 North America Active, Smart, and Intelligent Packaging Sales and Sales Share by Type (2013-2018)
5.3.2 North America Active, Smart, and Intelligent Packaging Revenue and Revenue Share by Type (2013-2018)
5.4 North America Active, Smart, and Intelligent Packaging Sales, Revenue and Market Share by Application (2013-2018)
5.4.1 North America Active, Smart, and Intelligent Packaging Sales and Sales Share by Application (2013-2018)
5.4.2 North America Active, Smart, and Intelligent Packaging Revenue and Revenue Share by Application (2013-2018)
6 Europe Active, Smart, and Intelligent Packaging by Countries, Type, Application and Manufacturers
6.1 Europe Active, Smart, and Intelligent Packaging Sales, Revenue and Market Share by Countries
6.1.1 Europe Active, Smart, and Intelligent Packaging Sales by Countries (2013-2018)
6.1.2 Europe Active, Smart, and Intelligent Packaging Revenue by Countries (2013-2018)
6.1.3 Germany Active, Smart, and Intelligent Packaging Sales and Growth Rate (2013-2018)
6.1.4 UK Active, Smart, and Intelligent Packaging Sales and Growth Rate (2013-2018)
6.1.5 France Active, Smart, and Intelligent Packaging Sales and Growth Rate (2013-2018)
6.1.6 Russia Active, Smart, and Intelligent Packaging Sales and Growth Rate (2013-2018)
6.1.7 Italy Active, Smart, and Intelligent Packaging Sales and Growth Rate (2013-2018)
6.2 Europe Active, Smart, and Intelligent Packaging Sales and Revenue (Value) by Manufacturers (2016-2017)
6.2.1 Europe Active, Smart, and Intelligent Packaging Sales by Manufacturers (2016-2017)
6.2.2 Europe Active, Smart, and Intelligent Packaging Revenue by Manufacturers (2016-2017)
6.3 Europe Active, Smart, and Intelligent Packaging Sales, Revenue and Market Share by Type (2013-2018)
6.3.1 Europe Active, Smart, and Intelligent Packaging Sales and Sales Share by Type (2013-2018)
6.3.2 Europe Active, Smart, and Intelligent Packaging Revenue and Revenue Share by Type (2013-2018)
6.4 Europe Active, Smart, and Intelligent Packaging Sales, Revenue and Market Share by Application (2013-2018)
6.4.1 Europe Active, Smart, and Intelligent Packaging Sales and Sales Share by Application (2013-2018)
6.4.2 Europe Active, Smart, and Intelligent Packaging Revenue and Revenue Share by Application (2013-2018)
7 Asia-Pacific Active, Smart, and Intelligent Packaging by Countries, Type, Application and Manufacturers
7.1 Asia-Pacific Active, Smart, and Intelligent Packaging Sales, Revenue and Market Share by Countries
7.1.1 Asia-Pacific Active, Smart, and Intelligent Packaging Sales by Countries (2013-2018)
7.1.2 Asia-Pacific Active, Smart, and Intelligent Packaging Revenue by Countries (2013-2018)
7.1.3 China Active, Smart, and Intelligent Packaging Sales and Growth Rate (2013-2018)
7.1.4 Japan Active, Smart, and Intelligent Packaging Sales and Growth Rate (2013-2018)
7.1.5 Korea Active, Smart, and Intelligent Packaging Sales and Growth Rate (2013-2018)
7.1.6 India Active, Smart, and Intelligent Packaging Sales and Growth Rate (2013-2018)
7.1.7 Southeast Asia Active, Smart, and Intelligent Packaging Sales and Growth Rate (2013-2018)
7.2 Asia-Pacific Active, Smart, and Intelligent Packaging Sales and Revenue (Value) by Manufacturers (2016-2017)
7.2.1 Asia-Pacific Active, Smart, and Intelligent Packaging Sales by Manufacturers (2016-2017)
7.2.2 Asia-Pacific Active, Smart, and Intelligent Packaging Revenue by Manufacturers (2016-2017)
7.3 Asia-Pacific Active, Smart, and Intelligent Packaging Sales, Revenue and Market Share by Type (2013-2018)
7.3.1 Asia-Pacific Active, Smart, and Intelligent Packaging Sales and Sales Share by Type (2013-2018)
7.3.2 Asia-Pacific Active, Smart, and Intelligent Packaging Revenue and Revenue Share by Type (2013-2018)
7.4 Asia-Pacific Active, Smart, and Intelligent Packaging Sales, Revenue and Market Share by Application (2013-2018)
7.4.1 Asia-Pacific Active, Smart, and Intelligent Packaging Sales and Sales Share by Application (2013-2018)
7.4.2 Asia-Pacific Active, Smart, and Intelligent Packaging Revenue and Revenue Share by Application (2013-2018)
8 South America Active, Smart, and Intelligent Packaging by Countries, Type, Application and Manufacturers
8.1 South America Active, Smart, and Intelligent Packaging Sales, Revenue and Market Share by Countries
8.1.1 South America Active, Smart, and Intelligent Packaging Sales by Countries (2013-2018)
8.1.2 South America Active, Smart, and Intelligent Packaging Revenue by Countries (2013-2018)
8.1.3 Brazil Active, Smart, and Intelligent Packaging Sales and Growth Rate (2013-2018)
8.1.4 Argentina Active, Smart, and Intelligent Packaging Sales and Growth Rate (2013-2018)
8.1.5 Colombia Active, Smart, and Intelligent Packaging Sales and Growth Rate (2013-2018)
8.2 South America Active, Smart, and Intelligent Packaging Sales and Revenue (Value) by Manufacturers (2016-2017)
8.2.1 South America Active, Smart, and Intelligent Packaging Sales by Manufacturers (2016-2017)
8.2.2 South America Active, Smart, and Intelligent Packaging Revenue by Manufacturers (2016-2017)
8.3 South America Active, Smart, and Intelligent Packaging Sales, Revenue and Market Share by Type (2013-2018)
8.3.1 South America Active, Smart, and Intelligent Packaging Sales and Sales Share by Type (2013-2018)
8.3.2 South America Active, Smart, and Intelligent Packaging Revenue and Revenue Share by Type (2013-2018)
8.4 South America Active, Smart, and Intelligent Packaging Sales, Revenue and Market Share by Application (2013-2018)
8.4.1 South America Active, Smart, and Intelligent Packaging Sales and Sales Share by Application (2013-2018)
8.4.2 South America Active, Smart, and Intelligent Packaging Revenue and Revenue Share by Application (2013-2018)
9 Middle East and Africa Active, Smart, and Intelligent Packaging by Countries, Type, Application and Manufacturers
9.1 Middle East and Africa Active, Smart, and Intelligent Packaging Sales, Revenue and Market Share by Countries
9.1.1 Middle East and Africa Active, Smart, and Intelligent Packaging Sales by Countries (2013-2018)
9.1.2 Middle East and Africa Active, Smart, and Intelligent Packaging Revenue by Countries (2013-2018)
9.1.3 Saudi Arabia Active, Smart, and Intelligent Packaging Sales and Growth Rate (2013-2018)
9.1.4 UAE Active, Smart, and Intelligent Packaging Sales and Growth Rate (2013-2018)
9.1.5 Egypt Active, Smart, and Intelligent Packaging Sales and Growth Rate (2013-2018)
9.1.6 Nigeria Active, Smart, and Intelligent Packaging Sales and Growth Rate (2013-2018)
9.1.7 South Africa Active, Smart, and Intelligent Packaging Sales and Growth Rate (2013-2018)
9.2 Middle East and Africa Active, Smart, and Intelligent Packaging Sales and Revenue (Value) by Manufacturers (2016-2017)
9.2.1 Middle East and Africa Active, Smart, and Intelligent Packaging Sales by Manufacturers (2016-2017)
9.2.2 Middle East and Africa Active, Smart, and Intelligent Packaging Revenue by Manufacturers (2016-2017)
9.3 Middle East and Africa Active, Smart, and Intelligent Packaging Sales, Revenue and Market Share by Type (2013-2018)
9.3.1 Middle East and Africa Active, Smart, and Intelligent Packaging Sales and Sales Share by Type (2013-2018)
9.3.1 Middle East and Africa Active, Smart, and Intelligent Packaging Revenue and Revenue Share by Type (2013-2018)
9.4 Middle East and Africa Active, Smart, and Intelligent Packaging Sales, Revenue and Market Share by Application (2013-2018)
9.4.1 Middle East and Africa Active, Smart, and Intelligent Packaging Sales and Sales Share by Application (2013-2018)
9.4.2 Middle East and Africa Active, Smart, and Intelligent Packaging Revenue and Revenue Share by Application (2013-2018)
10 Global Active, Smart, and Intelligent Packaging Market Segment by Type
10.1 Global Active, Smart, and Intelligent Packaging Sales, Revenue and Market Share by Type (2013-2018)
10.1.1 Global Active, Smart, and Intelligent Packaging Sales and Market Share by Type (2013-2018)
10.1.2 Global Active, Smart, and Intelligent Packaging Revenue and Market Share by Type (2013-2018)
10.2 O2 Scavenging Sachets Sales Growth and Price
10.2.1 Global O2 Scavenging Sachets Sales Growth (2013-2018)
10.2.2 Global O2 Scavenging Sachets Price (2013-2018)
10.3 MAP Sales Growth and Price
10.3.1 Global MAP Sales Growth (2013-2018)
10.3.2 Global MAP Price (2013-2018)
10.4 TTI Labels Sales Growth and Price
10.4.1 Global TTI Labels Sales Growth (2013-2018)
10.4.2 Global TTI Labels Price (2013-2018)
10.5 Freshness Indicators Sales Growth and Price
10.5.1 Global Freshness Indicators Sales Growth (2013-2018)
10.5.2 Global Freshness Indicators Price (2013-2018)
10.6 RFID Tags Sales Growth and Price
10.6.1 Global RFID Tags Sales Growth (2013-2018)
10.6.2 Global RFID Tags Price (2013-2018)
11 Global Active, Smart, and Intelligent Packaging Market Segment by Application
11.1 Global Active, Smart, and Intelligent Packaging Sales Market Share by Application (2013-2018)
11.2 Food & Beverage Sales Growth (2013-2018)
11.3 Pharmaceuticals Sales Growth (2013-2018)
11.4 Cosmetics Sales Growth (2013-2018)
11.5 Others Sales Growth (2013-2018)
12 Active, Smart, and Intelligent Packaging Market Forecast (2018-2023)
12.1 Global Active, Smart, and Intelligent Packaging Sales, Revenue and Growth Rate (2018-2023)
12.2 Active, Smart, and Intelligent Packaging Market Forecast by Regions (2018-2023)
12.2.1 North America Active, Smart, and Intelligent Packaging Market Forecast (2018-2023)
12.2.2 Europe Active, Smart, and Intelligent Packaging Market Forecast (2018-2023)
12.2.3 Asia-Pacific Active, Smart, and Intelligent Packaging Market Forecast (2018-2023)
12.2.4 South America Active, Smart, and Intelligent Packaging Market Forecast (2018-2023)
12.2.5 Middle East and Africa Active, Smart, and Intelligent Packaging Market Forecast (2018-2023)
12.3 Active, Smart, and Intelligent Packaging Market Forecast by Type (2018-2023)
12.3.1 Global Active, Smart, and Intelligent Packaging Sales Forecast by Type (2018-2023)
12.3.2 Global Active, Smart, and Intelligent Packaging Market Share Forecast by Type (2018-2023)
12.4 Active, Smart, and Intelligent Packaging Market Forecast by Application (2018-2023)
12.4.1 Global Active, Smart, and Intelligent Packaging Sales Forecast by Application (2018-2023)
12.4.2 Global Active, Smart, and Intelligent Packaging Market Share Forecast by Application (2018-2023)
13 Sales Channel, Distributors, Traders and Dealers
13.1 Sales Channel
13.1.1 Direct Marketing
13.1.2 Indirect Marketing
13.1.3 Marketing Channel Future Trend
13.2 Distributors, Traders and Dealers
14 Research Findings and Conclusion
15 Appendix
15.1 Methodology
15.2 Data Source
List of Tables and Figures
Figure Active, Smart, and Intelligent Packaging Picture
Table Product Specifications of Active, Smart, and Intelligent Packaging
Figure Global Active, Smart, and Intelligent Packaging CAGR (%), Y-o-Y Growth (&) and Market Size, 2013-2023 (USD Million)
Figure Global Active, Smart, and Intelligent Packaging CAGR (%), Y-o-Y Growth (&) and Market Size, 2013-2023 (Sales)
Figure Global Sales Market Share of Active, Smart, and Intelligent Packaging by Types in 2017
Figure O2 Scavenging Sachets Picture
Table Major Manufacturers of O2 Scavenging Sachets
Figure MAP Picture
Table Major Manufacturers of MAP
Figure TTI Labels Picture
Table Major Manufacturers of TTI Labels
Figure Freshness Indicators Picture
Table Major Manufacturers of Freshness Indicators
Figure RFID Tags Picture
Table Major Manufacturers of RFID Tags
Figure Active, Smart, and Intelligent Packaging Sales Market Share by Applications in 2017
Figure Food & Beverage Picture
Figure Pharmaceuticals Picture
Figure Cosmetics Picture
Figure Others Picture
Figure United States Active, Smart, and Intelligent Packaging Revenue (Value) and Growth Rate (2013-2023)
Figure Canada Active, Smart, and Intelligent Packaging Revenue (Value) and Growth Rate (2013-2023)
Figure Mexico Active, Smart, and Intelligent Packaging Revenue (Value) and Growth Rate (2013-2023)
Figure Germany Active, Smart, and Intelligent Packaging Revenue (Value) and Growth Rate (2013-2023)
Figure France Active, Smart, and Intelligent Packaging Revenue (Value) and Growth Rate (2013-2023)
Figure UK Active, Smart, and Intelligent Packaging Revenue (Value) and Growth Rate (2013-2023)
Figure Russia Active, Smart, and Intelligent Packaging Revenue (Value) and Growth Rate (2013-2023)
Figure Italy Active, Smart, and Intelligent Packaging Revenue (Value) and Growth Rate (2013-2023)
Figure China Active, Smart, and Intelligent Packaging Revenue (Value) and Growth Rate (2013-2023)
Figure Japan Active, Smart, and Intelligent Packaging Revenue (Value) and Growth Rate (2013-2023)
Figure Korea Active, Smart, and Intelligent Packaging Revenue (Value) and Growth Rate (2013-2023)
Figure India Active, Smart, and Intelligent Packaging Revenue (Value) and Growth Rate (2013-2023)
Figure Southeast Asia Active, Smart, and Intelligent Packaging Revenue (Value) and Growth Rate (2013-2023)
Figure Brazil Active, Smart, and Intelligent Packaging Revenue (Value) and Growth Rate (2013-2023)
Figure Egypt Active, Smart, and Intelligent Packaging Revenue (Value) and Growth Rate (2013-2023)
Figure Saudi Arabia Active, Smart, and Intelligent Packaging Revenue (Value) and Growth Rate (2013-2023)
Figure South Africa Active, Smart, and Intelligent Packaging Revenue (Value) and Growth Rate (2013-2023)
Figure Nigeria Active, Smart, and Intelligent Packaging Revenue (Value) and Growth Rate (2013-2023)
Table PakSense Headquarter, Established, Main Business and Finance Overview (2017)
Table PakSense Active, Smart, and Intelligent Packaging Production Bases, Sales Regions and Major Competitors
Table PakSense Active, Smart, and Intelligent Packaging Product
Table PakSense Active, Smart, and Intelligent Packaging Sales, Price, Revenue, Gross Margin and Market Share (2016-2017)
Figure Global PakSense Active, Smart, and Intelligent Packaging Sales Market Share in 2017
Figure Global PakSense Active, Smart, and Intelligent Packaging Revenue Market Share in 2017
Table Landec Headquarter, Established, Main Business and Finance Overview (2017)
Table Landec Active, Smart, and Intelligent Packaging Production Bases, Sales Regions and Major Competitors
Table Landec Active, Smart, and Intelligent Packaging Product
Table Landec Active, Smart, and Intelligent Packaging Sales, Price, Revenue, Gross Margin and Market Share (2016-2017)
Figure Global Landec Active, Smart, and Intelligent Packaging Sales Market Share in 2017
Figure Global Landec Active, Smart, and Intelligent Packaging Revenue Market Share in 2017
Table Sealed Air Headquarter, Established, Main Business and Finance Overview (2017)
Table Sealed Air Active, Smart, and Intelligent Packaging Production Bases, Sales Regions and Major Competitors
Table Sealed Air Active, Smart, and Intelligent Packaging Product
Table Sealed Air Active, Smart, and Intelligent Packaging Sales, Price, Revenue, Gross Margin and Market Share (2016-2017)
Figure Global Sealed Air Active, Smart, and Intelligent Packaging Sales Market Share in 2017
Figure Global Sealed Air Active, Smart, and Intelligent Packaging Revenue Market Share in 2017
Table Bemis Headquarter, Established, Main Business and Finance Overview (2017)
Table Bemis Active, Smart, and Intelligent Packaging Production Bases, Sales Regions and Major Competitors
Table Bemis Active, Smart, and Intelligent Packaging Product
Table Bemis Active, Smart, and Intelligent Packaging Sales, Price, Revenue, Gross Margin and Market Share (2016-2017)
Figure Global Bemis Active, Smart, and Intelligent Packaging Sales Market Share in 2017
Figure Global Bemis Active, Smart, and Intelligent Packaging Revenue Market Share in 2017
Table Crown Headquarter, Established, Main Business and Finance Overview (2017)
Table Crown Active, Smart, and Intelligent Packaging Production Bases, Sales Regions and Major Competitors
Table Crown Active, Smart, and Intelligent Packaging Product
Table Crown Active, Smart, and Intelligent Packaging Sales, Price, Revenue, Gross Margin and Market Share (2016-2017)
Figure Global Crown Active, Smart, and Intelligent Packaging Sales Market Share in 2017
Figure Global Crown Active, Smart, and Intelligent Packaging Revenue Market Share in 2017
Table Amcor Headquarter, Established, Main Business and Finance Overview (2017)
Table Amcor Active, Smart, and Intelligent Packaging Production Bases, Sales Regions and Major Competitors
Table Amcor Active, Smart, and Intelligent Packaging Product
Table Amcor Active, Smart, and Intelligent Packaging Sales, Price, Revenue, Gross Margin and Market Share (2016-2017)
Figure Global Amcor Active, Smart, and Intelligent Packaging Sales Market Share in 2017
Figure Global Amcor Active, Smart, and Intelligent Packaging Revenue Market Share in 2017
Table 3M Headquarter, Established, Main Business and Finance Overview (2017)
Table 3M Active, Smart, and Intelligent Packaging Production Bases, Sales Regions and Major Competitors
Table 3M Active, Smart, and Intelligent Packaging Product
Table 3M Active, Smart, and Intelligent Packaging Sales, Price, Revenue, Gross Margin and Market Share (2016-2017)
Figure Global 3M Active, Smart, and Intelligent Packaging Sales Market Share in 2017
Figure Global 3M Active, Smart, and Intelligent Packaging Revenue Market Share in 2017
Table Timestrip Headquarter, Established, Main Business and Finance Overview (2017)
Table Timestrip Active, Smart, and Intelligent Packaging Production Bases, Sales Regions and Major Competitors
Table Timestrip Active, Smart, and Intelligent Packaging Product
Table Timestrip Active, Smart, and Intelligent Packaging Sales, Price, Revenue, Gross Margin and Market Share (2016-2017)
Figure Global Timestrip Active, Smart, and Intelligent Packaging Sales Market Share in 2017
Figure Global Timestrip Active, Smart, and Intelligent Packaging Revenue Market Share in 2017
Table Cryolog Headquarter, Established, Main Business and Finance Overview (2017)
Table Cryolog Active, Smart, and Intelligent Packaging Production Bases, Sales Regions and Major Competitors
Table Cryolog Active, Smart, and Intelligent Packaging Product
Table Cryolog Active, Smart, and Intelligent Packaging Sales, Price, Revenue, Gross Margin and Market Share (2016-2017)
Figure Global Cryolog Active, Smart, and Intelligent Packaging Sales Market Share in 2017
Figure Global Cryolog Active, Smart, and Intelligent Packaging Revenue Market Share in 2017
Table Vitsab International Headquarter, Established, Main Business and Finance Overview (2017)
Table Vitsab International Active, Smart, and Intelligent Packaging Production Bases, Sales Regions and Major Competitors
Table Vitsab International Active, Smart, and Intelligent Packaging Product
Table Vitsab International Active, Smart, and Intelligent Packaging Sales, Price, Revenue, Gross Margin and Market Share (2016-2017)
Figure Global Vitsab International Active, Smart, and Intelligent Packaging Sales Market Share in 2017
Figure Global Vitsab International Active, Smart, and Intelligent Packaging Revenue Market Share in 2017
Table Varcode
Table Varcode Active, Smart, and Intelligent Packaging
Table LCR Hallcrest
Table LCR Hallcrest Active, Smart, and Intelligent Packaging
Table Thin Film Electronics
Table Thin Film Electronics Active, Smart, and Intelligent Packaging
Table CCL
Table CCL Active, Smart, and Intelligent Packaging
Table Temptime
Table Temptime Active, Smart, and Intelligent Packaging
Table Multisorb Technologies
Table Multisorb Technologies Active, Smart, and Intelligent Packaging
Table Coveris
Table Coveris Active, Smart, and Intelligent Packaging
Table Global Active, Smart, and Intelligent Packaging Sales by Manufacturer (2016-2017)
Figure Global Active, Smart, and Intelligent Packaging Sales Market Share by Manufacturer in 2016
Figure Global Active, Smart, and Intelligent Packaging Sales Market Share by Manufacturer in 2017
Table Global Active, Smart, and Intelligent Packaging Revenue by Manufacturer (2016-2017)
Figure Global Active, Smart, and Intelligent Packaging Revenue Market Share by Manufacturer in 2016
Figure Global Active, Smart, and Intelligent Packaging Revenue Market Share by Manufacturer in 2017
Table Global Active, Smart, and Intelligent Packaging Price by Manufacturer (2016-2017)
Figure Top 3 Active, Smart, and Intelligent Packaging Manufacturer (Revenue) Market Share in 2017
Figure Top 6 Active, Smart, and Intelligent Packaging Manufacturer (Revenue) Market Share in 2017
Figure Global Active, Smart, and Intelligent Packaging Sales and Growth Rate (2013-2018)
Figure Global Active, Smart, and Intelligent Packaging Revenue and Growth Rate (2013-2018)
Table Global Active, Smart, and Intelligent Packaging Sales by Regions (2013-2018)
Table Global Active, Smart, and Intelligent Packaging Sales Market Share by Regions (2013-2018)
Table Global Active, Smart, and Intelligent Packaging Revenue by Regions (2013-2018)
Figure Global Active, Smart, and Intelligent Packaging Revenue Market Share by Regions in 2013
Figure Global Active, Smart, and Intelligent Packaging Revenue Market Share by Regions in 2017
Figure North America Active, Smart, and Intelligent Packaging Sales and Growth Rate (2013-2018)
Figure North America Active, Smart, and Intelligent Packaging Revenue and Growth Rate (2013-2018)
Figure Europe Active, Smart, and Intelligent Packaging Sales and Growth Rate (2013-2018)
Figure Europe Active, Smart, and Intelligent Packaging Revenue and Growth Rate (2013-2018)
Figure Asia-Pacific Active, Smart, and Intelligent Packaging Sales and Growth Rate (2013-2018)
Figure Asia-Pacific Active, Smart, and Intelligent Packaging Revenue and Growth Rate (2013-2018)
Figure South America Active, Smart, and Intelligent Packaging Sales and Growth Rate (2013-2018)
Figure South America Active, Smart, and Intelligent Packaging Revenue and Growth Rate (2013-2018)
Figure Middle East and Africa Active, Smart, and Intelligent Packaging Sales and Growth Rate (2013-2018)
Figure Middle East and Africa Active, Smart, and Intelligent Packaging Revenue and Growth Rate (2013-2018)
Figure North America Active, Smart, and Intelligent Packaging Revenue and Growth Rate (2013-2018)
Table North America Active, Smart, and Intelligent Packaging Sales by Countries (2013-2018)
Table North America Active, Smart, and Intelligent Packaging Sales Market Share by Countries (2013-2018)
Figure North America Active, Smart, and Intelligent Packaging Sales Market Share by Countries in 2013
Figure North America Active, Smart, and Intelligent Packaging Sales Market Share by Countries in 2017
Table North America Active, Smart, and Intelligent Packaging Revenue by Countries (2013-2018)
Table North America Active, Smart, and Intelligent Packaging Revenue Market Share by Countries (2013-2018)
Figure North America Active, Smart, and Intelligent Packaging Revenue Market Share by Countries in 2013
Figure North America Active, Smart, and Intelligent Packaging Revenue Market Share by Countries in 2017
Figure United States Active, Smart, and Intelligent Packaging Sales and Growth Rate (2013-2018)
Figure Canada Active, Smart, and Intelligent Packaging Sales and Growth Rate (2013-2018)
Figure Mexico Active, Smart, and Intelligent Packaging Sales and Growth Rate (2013-2018)
Table North America Active, Smart, and Intelligent Packaging Sales by Manufacturer (2016-2017)
Figure North America Active, Smart, and Intelligent Packaging Sales Market Share by Manufacturer in 2016
Figure North America Active, Smart, and Intelligent Packaging Sales Market Share by Manufacturer in 2017
Table North America Active, Smart, and Intelligent Packaging Revenue by Manufacturer (2016-2017)
Figure North America Active, Smart, and Intelligent Packaging Revenue Market Share by Manufacturer in 2016
Figure North America Active, Smart, and Intelligent Packaging Revenue Market Share by Manufacturer in 2017
Table North America Active, Smart, and Intelligent Packaging Sales by Type (2013-2018)
Table North America Active, Smart, and Intelligent Packaging Sales Share by Type (2013-2018)
Table North America Active, Smart, and Intelligent Packaging Revenue by Type (2013-2018)
Table North America Active, Smart, and Intelligent Packaging Revenue Share by Type (2013-2018)
Table North America Active, Smart, and Intelligent Packaging Sales by Application (2013-2018)
Table North America Active, Smart, and Intelligent Packaging Sales Share by Application (2013-2018)
Table North America Active, Smart, and Intelligent Packaging Revenue by Application (2013-2018)
Table North America Active, Smart, and Intelligent Packaging Revenue Share by Application (2013-2018)
Figure Europe Active, Smart, and Intelligent Packaging Revenue and Growth Rate (2013-2018)
Table Europe Active, Smart, and Intelligent Packaging Sales by Countries (2013-2018)
Table Europe Active, Smart, and Intelligent Packaging Sales Market Share by Countries (2013-2018)
Table Europe Active, Smart, and Intelligent Packaging Revenue by Countries (2013-2018)
Figure Europe Active, Smart, and Intelligent Packaging Revenue Market Share by Countries in 2016
Figure Europe Active, Smart, and Intelligent Packaging Revenue Market Share by Countries in 2017
Figure Germany Active, Smart, and Intelligent Packaging Sales and Growth Rate (2013-2018)
Figure UK Active, Smart, and Intelligent Packaging Sales and Growth Rate (2013-2018)
Figure France Active, Smart, and Intelligent Packaging Sales and Growth Rate (2013-2018)
Figure Russia Active, Smart, and Intelligent Packaging Sales and Growth Rate (2013-2018)
Figure Italy Active, Smart, and Intelligent Packaging Sales and Growth Rate (2013-2018)
Table Europe Active, Smart, and Intelligent Packaging Sales by Manufacturer (2016-2017)
Figure Europe Active, Smart, and Intelligent Packaging Sales Market Share by Manufacturer in 2016
Figure Europe Active, Smart, and Intelligent Packaging Sales Market Share by Manufacturer in 2017
Table Europe Active, Smart, and Intelligent Packaging Revenue by Manufacturer (2016-2017)
Figure Europe Active, Smart, and Intelligent Packaging Revenue Market Share by Manufacturer in 2016
Figure Europe Active, Smart, and Intelligent Packaging Revenue Market Share by Manufacturer in 2017
Table Europe Active, Smart, and Intelligent Packaging Sales by Type (2013-2018)
Table Europe Active, Smart, and Intelligent Packaging Sales Share by Type (2013-2018)
Table Europe Active, Smart, and Intelligent Packaging Revenue by Type (2013-2018)
Table Europe Active, Smart, and Intelligent Packaging Revenue Share by Type (2013-2018)
Table Europe Active, Smart, and Intelligent Packaging Sales by Application (2013-2018)
Table Europe Active, Smart, and Intelligent Packaging Sales Share by Application (2013-2018)
Table Europe Active, Smart, and Intelligent Packaging Revenue by Application (2013-2018)
Table Europe Active, Smart, and Intelligent Packaging Revenue Share by Application (2013-2018)
Figure Asia-Pacific Active, Smart, and Intelligent Packaging Revenue and Growth Rate (2013-2018)
Table Asia-Pacific Active, Smart, and Intelligent Packaging Sales by Countries (2013-2018)
Table Asia-Pacific Active, Smart, and Intelligent Packaging Sales Market Share by Countries (2013-2018)
Figure Asia-Pacific Active, Smart, and Intelligent Packaging Sales Market Share by Countries 2017
Table Asia-Pacific Active, Smart, and Intelligent Packaging Revenue by Countries (2013-2018)
Figure Asia-Pacific Active, Smart, and Intelligent Packaging Revenue Market Share by Countries 2017
Figure China Active, Smart, and Intelligent Packaging Sales and Growth Rate (2013-2018)
Figure Japan Active, Smart, and Intelligent Packaging Sales and Growth Rate (2013-2018)
Figure Korea Active, Smart, and Intelligent Packaging Sales and Growth Rate (2013-2018)
Figure India Active, Smart, and Intelligent Packaging Sales and Growth Rate (2013-2018)
Figure Southeast Asia Active, Smart, and Intelligent Packaging Sales and Growth Rate (2013-2018)
Table Asia-Pacific Active, Smart, and Intelligent Packaging Sales by Manufacturer (2016-2017)
Figure Asia-Pacific Active, Smart, and Intelligent Packaging Sales Market Share by Manufacturer in 2016
Figure Asia-Pacific Active, Smart, and Intelligent Packaging Sales Market Share by Manufacturer in 2017
Table Asia-Pacific Active, Smart, and Intelligent Packaging Revenue by Manufacturer (2016-2017)
Figure Asia-Pacific Active, Smart, and Intelligent Packaging Revenue Market Share by Manufacturer in 2016
Figure Asia-Pacific Active, Smart, and Intelligent Packaging Revenue Market Share by Manufacturer in 2017
Table Asia-Pacific Active, Smart, and Intelligent Packaging Sales by Type (2013-2018)
Table Asia-Pacific Active, Smart, and Intelligent Packaging Sales Share by Type (2013-2018)
Table Asia-Pacific Active, Smart, and Intelligent Packaging Revenue by Type (2013-2018)
Table Asia-Pacific Active, Smart, and Intelligent Packaging Revenue Share by Type (2013-2018)
Table Asia-Pacific Active, Smart, and Intelligent Packaging Sales by Application (2013-2018)
Table Asia-Pacific Active, Smart, and Intelligent Packaging Sales Share by Application (2013-2018)
Table Asia-Pacific Active, Smart, and Intelligent Packaging Revenue by Application (2013-2018)
Table Asia-Pacific Active, Smart, and Intelligent Packaging Revenue Share by Application (2013-2018)
Figure South America Active, Smart, and Intelligent Packaging Revenue and Growth Rate (2013-2018)
Table South America Active, Smart, and Intelligent Packaging Sales by Countries (2013-2018)
Table South America Active, Smart, and Intelligent Packaging Sales Market Share by Countries (2013-2018)
Figure South America Active, Smart, and Intelligent Packaging Sales Market Share by Countries in 2017
Table South America Active, Smart, and Intelligent Packaging Revenue by Countries (2013-2018)
Table South America Active, Smart, and Intelligent Packaging Revenue Market Share by Countries (2013-2018)
Figure South America Active, Smart, and Intelligent Packaging Revenue Market Share by Countries in 2017
Figure Brazil Active, Smart, and Intelligent Packaging Sales and Growth Rate (2013-2018)
Figure Argentina Active, Smart, and Intelligent Packaging Sales and Growth Rate (2013-2018)
Figure Colombia Active, Smart, and Intelligent Packaging Sales and Growth Rate (2013-2018)
Table South America Active, Smart, and Intelligent Packaging Sales by Manufacturer (2016-2017)
Figure South America Active, Smart, and Intelligent Packaging Sales Market Share by Manufacturer in 2016
Figure South America Active, Smart, and Intelligent Packaging Sales Market Share by Manufacturer in 2017
Table South America Active, Smart, and Intelligent Packaging Revenue by Manufacturer (2016-2017)
Figure South America Active, Smart, and Intelligent Packaging Revenue Market Share by Manufacturer in 2016
Figure South America Active, Smart, and Intelligent Packaging Revenue Market Share by Manufacturer in 2017
Table South America Active, Smart, and Intelligent Packaging Sales by Type (2013-2018)
Table South America Active, Smart, and Intelligent Packaging Sales Share by Type (2013-2018)
Table South America Active, Smart, and Intelligent Packaging Revenue by Type (2013-2018)
Table South America Active, Smart, and Intelligent Packaging Revenue Share by Type (2013-2018)
Table South America Active, Smart, and Intelligent Packaging Sales by Application (2013-2018)
Table South America Active, Smart, and Intelligent Packaging Sales Share by Application (2013-2018)
Table South America Active, Smart, and Intelligent Packaging Revenue by Application (2013-2018)
Table South America Active, Smart, and Intelligent Packaging Revenue Share by Application (2013-2018)
Figure Middle East and Africa Active, Smart, and Intelligent Packaging Revenue and Growth Rate (2013-2018)
Table Middle East and Africa Active, Smart, and Intelligent Packaging Sales by Countries (2013-2018)
Table Middle East and Africa Active, Smart, and Intelligent Packaging Sales Market Share by Countries (2013-2018)
Figure Middle East and Africa Active, Smart, and Intelligent Packaging Sales Market Share by Countries in 2017
Table Middle East and Africa Active, Smart, and Intelligent Packaging Revenue by Countries (2013-2018)
Table Middle East and Africa Active, Smart, and Intelligent Packaging Revenue Market Share by Countries (2013-2018)
Figure Middle East and Africa Active, Smart, and Intelligent Packaging Revenue Market Share by Countries in 2013
Figure Middle East and Africa Active, Smart, and Intelligent Packaging Revenue Market Share by Countries in 2017
Figure Saudi Arabia Active, Smart, and Intelligent Packaging Sales and Growth Rate (2013-2018)
Figure UAE Active, Smart, and Intelligent Packaging Sales and Growth Rate (2013-2018)
Figure Egypt Active, Smart, and Intelligent Packaging Sales and Growth Rate (2013-2018)
Figure Nigeria Active, Smart, and Intelligent Packaging Sales and Growth Rate (2013-2018)
Figure South Africa Active, Smart, and Intelligent Packaging Sales and Growth Rate (2013-2018)
Table Middle East and Africa Active, Smart, and Intelligent Packaging Sales by Manufacturer (2016-2017)
Figure Middle East and Africa Active, Smart, and Intelligent Packaging Sales Market Share by Manufacturer in 2016
Figure Middle East and Africa Active, Smart, and Intelligent Packaging Sales Market Share by Manufacturer in 2017
Table Middle East and Africa Active, Smart, and Intelligent Packaging Revenue by Manufacturer (2016-2017)
Figure Middle East and Africa Active, Smart, and Intelligent Packaging Revenue Market Share by Manufacturer in 2016
Figure Middle East and Africa Active, Smart, and Intelligent Packaging Revenue Market Share by Manufacturer in 2017
Table Middle East and Africa Active, Smart, and Intelligent Packaging Sales by Type (2013-2018)
Table Middle East and Africa Active, Smart, and Intelligent Packaging Sales Share by Type (2013-2018)
Table Middle East and Africa Active, Smart, and Intelligent Packaging Revenue by Type (2013-2018)
Table Middle East and Africa Active, Smart, and Intelligent Packaging Revenue Share by Type (2013-2018)
Table Middle East and Africa Active, Smart, and Intelligent Packaging Sales by Application (2013-2018)
Table Middle East and Africa Active, Smart, and Intelligent Packaging Sales Share by Application (2013-2018)
Table Middle East and Africa Active, Smart, and Intelligent Packaging Revenue by Application (2013-2018)
Table Middle East and Africa Active, Smart, and Intelligent Packaging Revenue Share by Application (2013-2018)
Table Global Active, Smart, and Intelligent Packaging Sales by Type (2013-2018)
Table Global Active, Smart, and Intelligent Packaging Sales Share by Type (2013-2018)
Table Global Active, Smart, and Intelligent Packaging Revenue by Type (2013-2018)
Table Global Active, Smart, and Intelligent Packaging Revenue Share by Type (2013-2018)
Figure Global O2 Scavenging Sachets Sales Growth (2013-2018)
Figure Global O2 Scavenging Sachets Price (2013-2018)
Figure Global MAP Sales Growth (2013-2018)
Figure Global MAP Price (2013-2018)
Figure Global TTI Labels Sales Growth (2013-2018)
Figure Global TTI Labels Price (2013-2018)
Figure Global Freshness Indicators Sales Growth (2013-2018)
Figure Global Freshness Indicators Price (2013-2018)
Figure Global RFID Tags Sales Growth (2013-2018)
Figure Global RFID Tags Price (2013-2018)
Table Global Active, Smart, and Intelligent Packaging Sales by Application (2013-2018)
Table Global Active, Smart, and Intelligent Packaging Sales Share by Application (2013-2018)
Figure Global Food & Beverage Sales Growth (2013-2018)
Figure Global Pharmaceuticals Sales Growth (2013-2018)
Figure Global Cosmetics Sales Growth (2013-2018)
Figure Global Others Sales Growth (2013-2018)
Figure Global Active, Smart, and Intelligent Packaging Sales, Revenue and Growth Rate (2018-2023)
Table Global Active, Smart, and Intelligent Packaging Sales Forecast by Regions (2018-2023)
Table Global Active, Smart, and Intelligent Packaging Market Share Forecast by Regions (2018-2023)
Figure North America Sales Active, Smart, and Intelligent Packaging Market Forecast (2018-2023)
Figure Europe Sales Active, Smart, and Intelligent Packaging Market Forecast (2018-2023)
Figure Asia-Pacific Sales Active, Smart, and Intelligent Packaging Market Forecast (2018-2023)
Figure South America Sales Active, Smart, and Intelligent Packaging Market Forecast (2018-2023)
Figure Middle East and Africa Sales Active, Smart, and Intelligent Packaging Market Forecast (2018-2023)
Table Global Active, Smart, and Intelligent Packaging Sales Forecast by Type (2018-2023)
Table Global Active, Smart, and Intelligent Packaging Market Share Forecast by Type (2018-2023)
Table Global Active, Smart, and Intelligent Packaging Sales Forecast by Application (2018-2023)
Table Global Active, Smart, and Intelligent Packaging Market Share Forecast by Application (2018-2023)
Table Distributors/Traders/ Dealers List
*If Applicable.
