
Table of Contents
2018-2023 Global 3D Optical Surface Profilers (Profilometers) Consumption Market Report
1 Scope of the Report
1.1 Market Introduction
1.2 Research Objectives
1.3 Years Considered
1.4 Market Research Methodology
1.5 Economic Indicators
1.6 Currency Considered
2 Executive Summary
2.1 World Market Overview
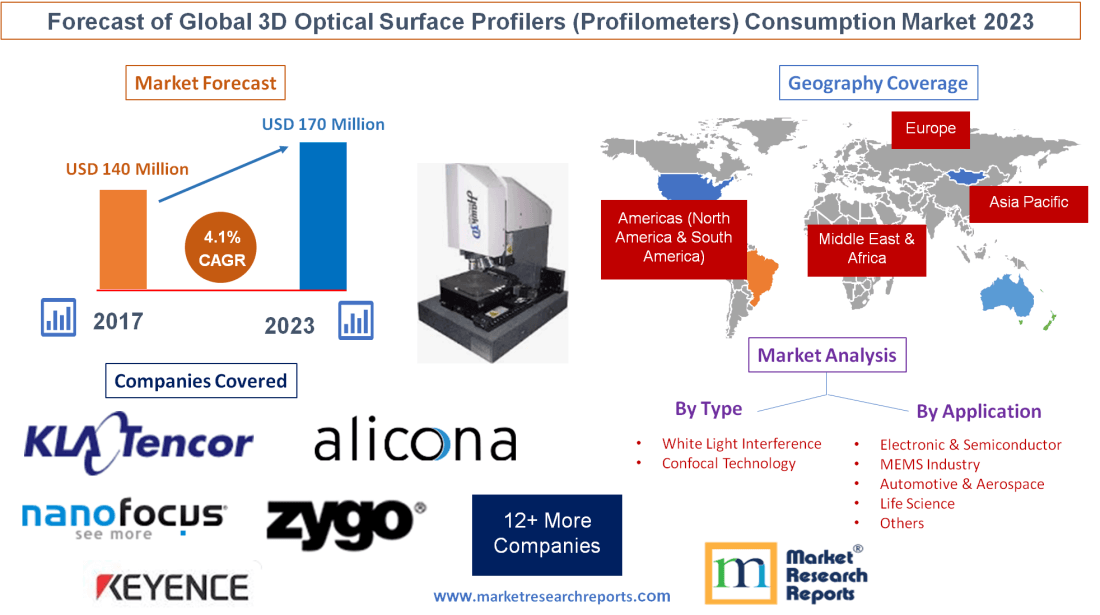
2.1.1 Global 3D Optical Surface Profilers (Profilometers) Consumption 2013-2023
2.1.2 3D Optical Surface Profilers (Profilometers) Consumption CAGR by Region
2.2 3D Optical Surface Profilers (Profilometers) Segment by Type
2.2.1 White Light Interference
2.2.2 Confocal Technology
2.3 3D Optical Surface Profilers (Profilometers) Consumption by Type
2.3.1 Global 3D Optical Surface Profilers (Profilometers) Consumption Market Share by Type (2013-2018)
2.3.2 Global 3D Optical Surface Profilers (Profilometers) Revenue and Market Share by Type (2013-2018)
2.3.3 Global 3D Optical Surface Profilers (Profilometers) Sale Price by Type (2013-2018)
2.4 3D Optical Surface Profilers (Profilometers) Segment by Application
2.4.1 Electronic & Semiconductor
2.4.2 MEMS Industry
2.4.3 Automotive & Aerospace
2.4.4 Life Science
2.4.5 Others
2.5 3D Optical Surface Profilers (Profilometers) Consumption by Application
2.5.1 Global 3D Optical Surface Profilers (Profilometers) Consumption Market Share by Application (2013-2018)
2.5.2 Global 3D Optical Surface Profilers (Profilometers) Value and Market Share by Application (2013-2018)
2.5.3 Global 3D Optical Surface Profilers (Profilometers) Sale Price by Application (2013-2018)
3 Global 3D Optical Surface Profilers (Profilometers) by Players
3.1 Global 3D Optical Surface Profilers (Profilometers) Sales Market Share by Players
3.1.1 Global 3D Optical Surface Profilers (Profilometers) Sales by Players (2016-2018)
3.1.2 Global 3D Optical Surface Profilers (Profilometers) Sales Market Share by Players (2016-2018)
3.2 Global 3D Optical Surface Profilers (Profilometers) Revenue Market Share by Players
3.2.1 Global 3D Optical Surface Profilers (Profilometers) Revenue by Players (2016-2018)
3.2.2 Global 3D Optical Surface Profilers (Profilometers) Revenue Market Share by Players (2016-2018)
3.3 Global 3D Optical Surface Profilers (Profilometers) Sale Price by Players
3.4 Global 3D Optical Surface Profilers (Profilometers) Manufacturing Base Distribution, Sales Area, Product Types by Players
3.4.1 Global 3D Optical Surface Profilers (Profilometers) Manufacturing Base Distribution and Sales Area by Players
3.4.2 Players 3D Optical Surface Profilers (Profilometers) Products Offered
3.5 Market Concentration Rate Analysis
3.5.1 Competition Landscape Analysis
3.5.2 Concentration Ratio (CR3, CR5 and CR10) (2016-2018)
3.6 New Products and Potential Entrants
3.7 Mergers & Acquisitions, Expansion
4 3D Optical Surface Profilers (Profilometers) by Regions
4.1 3D Optical Surface Profilers (Profilometers) by Regions
4.1.1 Global 3D Optical Surface Profilers (Profilometers) Consumption by Regions
4.1.2 Global 3D Optical Surface Profilers (Profilometers) Value by Regions
4.2 Americas 3D Optical Surface Profilers (Profilometers) Consumption Growth
4.3 APAC 3D Optical Surface Profilers (Profilometers) Consumption Growth
4.4 Europe 3D Optical Surface Profilers (Profilometers) Consumption Growth
4.5 Middle East & Africa 3D Optical Surface Profilers (Profilometers) Consumption Growth
5 Americas
5.1 Americas 3D Optical Surface Profilers (Profilometers) Consumption by Countries
5.1.1 Americas 3D Optical Surface Profilers (Profilometers) Consumption by Countries (2013-2018)
5.1.2 Americas 3D Optical Surface Profilers (Profilometers) Value by Countries (2013-2018)
5.2 Americas 3D Optical Surface Profilers (Profilometers) Consumption by Type
5.3 Americas 3D Optical Surface Profilers (Profilometers) Consumption by Application
5.4 United States
5.5 Canada
5.6 Mexico
5.7 Key Economic Indicators of Few Americas Countries
6 APAC
6.1 APAC 3D Optical Surface Profilers (Profilometers) Consumption by Countries
6.1.1 APAC 3D Optical Surface Profilers (Profilometers) Consumption by Countries (2013-2018)
6.1.2 APAC 3D Optical Surface Profilers (Profilometers) Value by Countries (2013-2018)
6.2 APAC 3D Optical Surface Profilers (Profilometers) Consumption by Type
6.3 APAC 3D Optical Surface Profilers (Profilometers) Consumption by Application
6.4 China
6.5 Japan
6.6 Korea
6.7 Southeast Asia
6.8 India
6.9 Australia
6.10 Key Economic Indicators of Few APAC Countries
7 Europe
7.1 Europe 3D Optical Surface Profilers (Profilometers) by Countries
7.1.1 Europe 3D Optical Surface Profilers (Profilometers) Consumption by Countries (2013-2018)
7.1.2 Europe 3D Optical Surface Profilers (Profilometers) Value by Countries (2013-2018)
7.2 Europe 3D Optical Surface Profilers (Profilometers) Consumption by Type
7.3 Europe 3D Optical Surface Profilers (Profilometers) Consumption by Application
7.4 Germany
7.5 France
7.6 UK
7.7 Italy
7.8 Russia
7.9 Spain
7.10 Key Economic Indicators of Few Europe Countries
8 Middle East & Africa
8.1 Middle East & Africa 3D Optical Surface Profilers (Profilometers) by Countries
8.1.1 Middle East & Africa 3D Optical Surface Profilers (Profilometers) Consumption by Countries (2013-2018)
8.1.2 Middle East & Africa 3D Optical Surface Profilers (Profilometers) Value by Countries (2013-2018)
8.2 Middle East & Africa 3D Optical Surface Profilers (Profilometers) Consumption by Type
8.3 Middle East & Africa 3D Optical Surface Profilers (Profilometers) Consumption by Application
8.4 Egypt
8.5 South Africa
8.6 Israel
8.7 Turkey
8.8 GCC Countries
9 Market Drivers, Challenges and Trends
9.1 Market Drivers and Impact
9.1.1 Growing Demand from Key Regions
9.1.2 Growing Demand from Key Applications and Potential Industries
9.2 Market Challenges and Impact
9.3 Market Trends
10 Marketing, Distributors and Customer
10.1 Sales Channel
10.1.1 Direct Marketing
10.1.2 Indirect Marketing
10.2 3D Optical Surface Profilers (Profilometers) Distributors
10.3 3D Optical Surface Profilers (Profilometers) Customer
11 Global 3D Optical Surface Profilers (Profilometers) Market Forecast
11.1 Global 3D Optical Surface Profilers (Profilometers) Consumption Forecast (2018-2023)
11.2 Global 3D Optical Surface Profilers (Profilometers) Forecast by Regions
11.2.1 Global 3D Optical Surface Profilers (Profilometers) Forecast by Regions (2018-2023)
11.2.2 Global 3D Optical Surface Profilers (Profilometers) Value Forecast by Regions (2018-2023)
11.2.3 Americas Consumption Forecast
11.2.4 APAC Consumption Forecast
11.2.5 Europe Consumption Forecast
11.2.6 Middle East & Africa Consumption Forecast
11.3 Americas Forecast by Countries
11.3.1 United States Market Forecast
11.3.2 Canada Market Forecast
11.3.3 Mexico Market Forecast
11.3.4 Brazil Market Forecast
11.4 APAC Forecast by Countries
11.4.1 China Market Forecast
11.4.2 Japan Market Forecast
11.4.3 Korea Market Forecast
11.4.4 Southeast Asia Market Forecast
11.4.5 India Market Forecast
11.4.6 Australia Market Forecast
11.5 Europe Forecast by Countries
11.5.1 Germany Market Forecast
11.5.2 France Market Forecast
11.5.3 UK Market Forecast
11.5.4 Italy Market Forecast
11.5.5 Russia Market Forecast
11.5.6 Spain Market Forecast
11.6 Middle East & Africa Forecast by Countries
11.6.1 Egypt Market Forecast
11.6.2 South Africa Market Forecast
11.6.3 Israel Market Forecast
11.6.4 Turkey Market Forecast
11.6.5 GCC Countries Market Forecast
11.7 Global 3D Optical Surface Profilers (Profilometers) Forecast by Type
11.8 Global 3D Optical Surface Profilers (Profilometers) Forecast by Application
12 Key Players Analysis
12.1 Zygo
12.1.1 Company Details
12.1.2 3D Optical Surface Profilers (Profilometers) Product Offered
12.1.3 Zygo 3D Optical Surface Profilers (Profilometers) Sales, Revenue, Price and Gross Margin (2016-2018)
12.1.4 Main Business Overview
12.1.5 Zygo News
12.2 KLA-Tencor
12.2.1 Company Details
12.2.2 3D Optical Surface Profilers (Profilometers) Product Offered
12.2.3 KLA-Tencor 3D Optical Surface Profilers (Profilometers) Sales, Revenue, Price and Gross Margin (2016-2018)
12.2.4 Main Business Overview
12.2.5 KLA-Tencor News
12.3 Alicona
12.3.1 Company Details
12.3.2 3D Optical Surface Profilers (Profilometers) Product Offered
12.3.3 Alicona 3D Optical Surface Profilers (Profilometers) Sales, Revenue, Price and Gross Margin (2016-2018)
12.3.4 Main Business Overview
12.3.5 Alicona News
12.4 Bruker Nano Surfaces
12.4.1 Company Details
12.4.2 3D Optical Surface Profilers (Profilometers) Product Offered
12.4.3 Bruker Nano Surfaces 3D Optical Surface Profilers (Profilometers) Sales, Revenue, Price and Gross Margin (2016-2018)
12.4.4 Main Business Overview
12.4.5 Bruker Nano Surfaces News
12.5 Sensofar
12.5.1 Company Details
12.5.2 3D Optical Surface Profilers (Profilometers) Product Offered
12.5.3 Sensofar 3D Optical Surface Profilers (Profilometers) Sales, Revenue, Price and Gross Margin (2016-2018)
12.5.4 Main Business Overview
12.5.5 Sensofar News
12.6 Keyence
12.6.1 Company Details
12.6.2 3D Optical Surface Profilers (Profilometers) Product Offered
12.6.3 Keyence 3D Optical Surface Profilers (Profilometers) Sales, Revenue, Price and Gross Margin (2016-2018)
12.6.4 Main Business Overview
12.6.5 Keyence News
12.7 NanoFocus
12.7.1 Company Details
12.7.2 3D Optical Surface Profilers (Profilometers) Product Offered
12.7.3 NanoFocus 3D Optical Surface Profilers (Profilometers) Sales, Revenue, Price and Gross Margin (2016-2018)
12.7.4 Main Business Overview
12.7.5 NanoFocus News
12.8 Cyber Technologies
12.8.1 Company Details
12.8.2 3D Optical Surface Profilers (Profilometers) Product Offered
12.8.3 Cyber Technologies 3D Optical Surface Profilers (Profilometers) Sales, Revenue, Price and Gross Margin (2016-2018)
12.8.4 Main Business Overview
12.8.5 Cyber Technologies News
12.9 Polytec GmbH
12.9.1 Company Details
12.9.2 3D Optical Surface Profilers (Profilometers) Product Offered
12.9.3 Polytec GmbH 3D Optical Surface Profilers (Profilometers) Sales, Revenue, Price and Gross Margin (2016-2018)
12.9.4 Main Business Overview
12.9.5 Polytec GmbH News
12.10 Mahr
12.10.1 Company Details
12.10.2 3D Optical Surface Profilers (Profilometers) Product Offered
12.10.3 Mahr 3D Optical Surface Profilers (Profilometers) Sales, Revenue, Price and Gross Margin (2016-2018)
12.10.4 Main Business Overview
12.10.5 Mahr News
12.11 4D Technology
12.12 Chroma
12.13 Leica
12.14 Nanovea
13 Research Findings and Conclusion
*If Applicable.
