

1 Animal Growth Promoter Market Overview
1.1 Product Overview and Scope of Animal Growth Promoter
1.2 Animal Growth Promoter Segment by Types
1.2.1 Global Sales Market Share of Animal Growth Promoter by Types in 2017
1.2.2 Antibiotic
1.2.2.1 Major Players of Type I
1.2.3 Prebiotics and Probiotics
1.2.3.1 Major Players of Prebiotics and Probiotics
1.2.4 Feed Enzymes
1.2.4.1 Major Players of Feed Enzymes
1.2.5 Others
1.2.5.1 Major Players of Others
1.3 Animal Growth Promoter Segment by Applications
1.3.1 Animal Growth Promoter Sales Market Share by Applications in 2017
1.3.2 Livestock
1.3.3 Aquaculture
1.3.4 Poultry
1.3.5 Other
1.4 Animal Growth Promoter Market by Regions
1.4.1 North America Status and Prospect (2013-2023)
1.4.1.1 North America Animal Growth Promoter Revenue (Million USD) and Growth Rate (2013-2023)
1.4.2 Asia-Pacific Status and Prospect (2013-2023)
1.4.2.1 Asia-Pacific Animal Growth Promoter Revenue (Million USD) and Growth Rate (2013-2023)
1.4.3 Europe Status and Prospect (2013-2023)
1.4.3.1 Europe Animal Growth Promoter Revenue (Million USD) and Growth Rate (2013-2023)
1.4.4 South America Status and Prospect (2013-2023)
1.4.4.1 South America Animal Growth Promoter Revenue (Million USD) and Growth Rate (2013-2023)
1.4.5 Middle East and Africa Status and Prospect (2013-2023)
1.4.5.1 Middle East and Africa Animal Growth Promoter Revenue (Million USD) and Growth Rate (2013-2023)
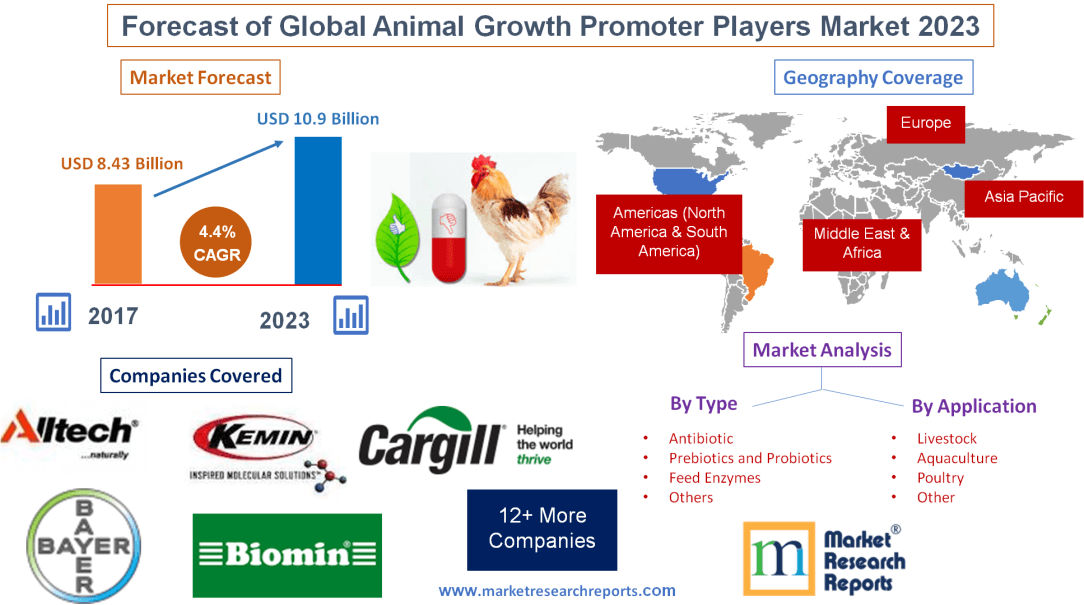
1.5 Global Market Size (Value) of Animal Growth Promoter (2013-2023)
2 Global Animal Growth Promoter Sales, Revenue (Value) and Market Share by Players
2.1 Global Animal Growth Promoter Sales and Market Share by Players in 2016 and 2017
2.1.1 Global Animal Growth Promoter Sales by Players in 2016 and 2017
2.1.2 Global Animal Growth Promoter Sales Market Share (%) by Players in 2016 and 2017
2.2 Global Animal Growth Promoter Revenue and Market Share by Players in 2016 and 2017
2.2.1 Global Animal Growth Promoter Revenue by Players in 2016 and 2017
2.2.2 Global Animal Growth Promoter Revenue Market Share (%) by Players in 2016 and 2017
2.3 Global Animal Growth Promoter Average Price by Players in 2016 and 2017
2.4 Global Animal Growth Promoter Manufacturing Base Distribution, Sales Area, Product Types by Players
2.4.1 Global Animal Growth Promoter Manufacturing Base Distribution and Sales Area by Players
2.4.2 Players Animal Growth Promoter Product Types
2.5 Animal Growth Promoter Market Competitive Situation and Trends
2.5.1 Animal Growth Promoter Market Concentration Rate
2.5.2 Animal Growth Promoter Market Share of Top 3 and Top 5 Players
2.5.3 Mergers & Acquisitions, Expansion
3 Global Animal Growth Promoter Sales, Revenue (Value) by Regions, Type and Application (2013-2018)
3.1 Global Animal Growth Promoter Sales, Revenue and Market Share by Regions (2013-2018)
3.1.1 Global Animal Growth Promoter Sales and Market Share by Regions (2013-2018)
3.1.2 Global Animal Growth Promoter Revenue and Market Share by Regions (2013-2018)
3.2 Global Animal Growth Promoter Sales, Revenue, Market Share and Price by Type (2013-2018)
3.2.1 Global Animal Growth Promoter Sales and Market Share by Type (2013-2018)
3.2.2 Global Animal Growth Promoter Revenue and Market Share by Type (2013-2018)
3.2.3 Global Animal Growth Promoter Price by Type (2013-2018)
3.3 Global Animal Growth Promoter Sales and Market Share by Application (2013-2018)
3.3.1 Global Animal Growth Promoter Sales by Application (2013-2018)
3.3.2 Global Animal Growth Promoter Sales Market Share by Application (2013-2018)
3.4 Global Animal Growth Promoter Sales, Revenue, Price and Gross Margin (2013-2018)
4 North America Top 5 Players Animal Growth Promoter Sales, Revenue and Price
4.1 North America Top 5 Players Animal Growth Promoter Sales, Revenue and Market Share in 2016 and 2017
4.1.1 North America Top 5 Players Animal Growth Promoter Sales and Market Share in 2016 and 2017
4.1.2 North America Top 5 Players Animal Growth Promoter Revenue and Market Share in 2016 and 2017
4.2 North America Animal Growth Promoter Sales, Revenue, Market Share and Price by Type (2013-2018)
4.2.1 North America Animal Growth Promoter Sales and Market Share by Type (2013-2018)
4.2.1.1 North America Animal Growth Promoter Sales by Type (2013-2018)
4.2.1.2 North America Animal Growth Promoter Sales Market Share by Type (2013-2018)
4.2.2 North America Animal Growth Promoter Revenue and Market Share by Type (2013-2018)
4.2.2.1 North America Animal Growth Promoter Revenue by Type (2013-2018)
4.2.2.2 North America Animal Growth Promoter Revenue Market Share by Type (2013-2018)
4.2.3 North America Animal Growth Promoter Price by Type (2013-2018)
4.3 North America Animal Growth Promoter Sales and Market Share by Application (2013-2018)
4.3.1 North America Animal Growth Promoter Sales by Application (2013-2018)
4.3.2 North America Animal Growth Promoter Sales Market Share by Application (2013-2018)
4.4 North America Animal Growth Promoter Sales and Market Share by Country (US, Canada and Mexico) (2013-2018)
4.4.1 North America Animal Growth Promoter Sales by Country (2013-2018)
4.4.2 North America Animal Growth Promoter Sales Market Share by Country (2013-2018)
4.5 North America Animal Growth Promoter Import & Export (2013-2018)
5 Europe Top 5 Players Animal Growth Promoter Sales, Revenue and Price
5.1 Europe Top 5 Players Animal Growth Promoter Sales, Revenue and Market Share in 2016 and 2017
5.1.1 Europe Top 5 Players Animal Growth Promoter Sales and Market Share in 2016 and 2017
5.1.2 Europe Top 5 Players Animal Growth Promoter Revenue and Market Share in 2016 and 2017
5.2 Europe Animal Growth Promoter Sales, Revenue, Market Share and Price by Type (2013-2018)
5.2.1 Europe Animal Growth Promoter Sales and Market Share by Type (2013-2018)
5.2.1.1 Europe Animal Growth Promoter Sales by Type (2013-2018)
5.2.1.2 Europe Animal Growth Promoter Sales Market Share by Type (2013-2018)
5.2.2 Europe Animal Growth Promoter Revenue and Market Share by Type (2013-2018)
5.2.2.1 Europe Animal Growth Promoter Revenue by Type (2013-2018)
5.2.2.2 Europe Animal Growth Promoter Revenue Market Share by Type (2013-2018)
5.2.3 Europe Animal Growth Promoter Price by Type (2013-2018)
5.3 Europe Animal Growth Promoter Sales and Market Share by Application (2013-2018)
5.3.1 Europe Animal Growth Promoter Sales by Application (2013-2018)
5.3.2 Europe Animal Growth Promoter Sales Market Share by Application (2013-2018)
5.4 Europe Animal Growth Promoter Sales and Market Share by Country (Germany, UK, France, Italy and Russia) (2013-2018)
5.4.1 Europe Animal Growth Promoter Sales by Country (2013-2018)
5.4.2 Europe Animal Growth Promoter Sales Market Share by Country (2013-2018)
5.5 Europe Animal Growth Promoter Import & Export (2013-2018)
6 Asia-Pacific Top 5 Players Animal Growth Promoter Sales, Revenue and Price
6.1 Asia-Pacific Top 5 Players Animal Growth Promoter Sales, Revenue and Market Share in 2016 and 2017
6.1.1 Asia-Pacific Top 5 Players Animal Growth Promoter Sales and Market Share in 2016 and 2017
6.1.2 Asia-Pacific Top 5 Players Animal Growth Promoter Revenue and Market Share in 2016 and 2017
6.2 Asia-Pacific Animal Growth Promoter Sales, Revenue, Market Share and Price by Type (2013-2018)
6.2.1 Asia-Pacific Animal Growth Promoter Sales and Market Share by Type (2013-2018)
6.2.1.1 Asia-Pacific Animal Growth Promoter Sales by Type (2013-2018)
6.2.1.2 Asia-Pacific Animal Growth Promoter Sales Market Share by Type (2013-2018)
6.2.2 Asia-Pacific Animal Growth Promoter Revenue and Market Share by Type (2013-2018)
6.2.3 Asia-Pacific Animal Growth Promoter Price by Type (2013-2018)
6.3 Asia-Pacific Animal Growth Promoter Sales and Market Share by Application (2013-2018)
6.3.1 Asia-Pacific Animal Growth Promoter Sales by Application (2013-2018)
6.3.2 Asia-Pacific Animal Growth Promoter Sales Market Share by Application (2013-2018)
6.4 Asia-Pacific Animal Growth Promoter Sales and Market Share by Country (China, Japan, Southeast Asia, India, Korea and Australia) (2013-2018)
6.4.1 Asia-Pacific Animal Growth Promoter Sales by Country (2013-2018)
6.4.2 Asia-Pacific Animal Growth Promoter Sales Market Share by Country (2013-2018)
6.5 Asia-Pacific Animal Growth Promoter Import & Export (2013-2018)
7 South America Top 5 Players Animal Growth Promoter Sales, Revenue and Price
7.1 South America Top 5 Players Animal Growth Promoter Sales, Revenue and Market Share in 2016 and 2017
7.1.1 South America Top 5 Players Animal Growth Promoter Sales and Market Share in 2016 and 2017
7.1.2 South America Top 5 Players Animal Growth Promoter Revenue and Market Share in 2016 and 2017
7.2 South America Animal Growth Promoter Sales, Revenue, Market Share and Price by Type (2013-2018)
7.2.1 South America Animal Growth Promoter Sales and Market Share by Type (2013-2018)
7.2.1.1 South America Animal Growth Promoter Sales by Type (2013-2018)
7.2.1.2 South America Animal Growth Promoter Sales Market Share by Type (2013-2018)
7.2.2 South America Animal Growth Promoter Revenue and Market Share by Type (2013-2018)
7.2.2.1 South America Animal Growth Promoter Revenue by Type (2013-2018)
7.2.2.2 South America Animal Growth Promoter Revenue and Market Share by Type (2013-2018)
7.2.3 South America Animal Growth Promoter Price by Type (2013-2018)
7.3 South America Animal Growth Promoter Sales and Market Share by Application (2013-2018)
7.3.1 South America Animal Growth Promoter Sales by Application (2013-2018)
7.3.2 South America Animal Growth Promoter Sales Market Share by Application (2013-2018)
7.4 South America Animal Growth Promoter Sales and Market Share by Country (Brazil, Argentina, Chile and Peru) (2013-2018)
7.4.1 South America Animal Growth Promoter Sales by Country (2013-2018)
7.4.2 South America Animal Growth Promoter Sales Market Share by Country (2013-2018)
7.5 South America Animal Growth Promoter Import & Export (2013-2018)
8 Middle East & Africa Top 5 Players Animal Growth Promoter Sales, Revenue and Price
8.1 Middle East & Africa Top 5 Players Animal Growth Promoter Sales, Revenue and Market Share in 2016 and 2017
8.1.1 Middle East & Africa Top 5 Players Animal Growth Promoter Sales and Market Share in 2016 and 2017
8.1.2 Middle East & Africa Top 5 Players Animal Growth Promoter Revenue and Market Share in 2016 and 2017
8.2 Middle East & Africa Animal Growth Promoter Sales, Revenue, Market Share and Price by Type (2013-2018)
8.2.1 Middle East & Africa Animal Growth Promoter Sales and Market Share by Type (2013-2018)
8.2.1.1 Middle East & Africa Animal Growth Promoter Sales by Type (2013-2018)
8.2.1.2 Middle East & Africa Animal Growth Promoter Sales Market Share by Type (2013-2018)
8.2.2 Middle East & Africa Animal Growth Promoter Revenue and Market Share by Type (2013-2018)
8.2.2.1 Middle East & Africa Animal Growth Promoter Revenue by Type (2013-2018)
8.2.2.2 Middle East & Africa Animal Growth Promoter Revenue Market Share by Type (2013-2018)
8.2.3 Middle East & Africa Animal Growth Promoter Price by Type (2013-2018)
8.3 Middle East & Africa Animal Growth Promoter Sales and Market Share by Application (2013-2018)
8.3.1 Middle East & Africa Animal Growth Promoter Sales by Application (2013-2018)
8.3.2 Middle East & Africa Animal Growth Promoter Sales Market Share by Application (2013-2018)
8.4 Middle East & Africa Animal Growth Promoter Sales and Market Share by Country (Egypt, Saudi Arabia, South Africa and Iran) (2013-2018)
8.4.1 Middle East & Africa Animal Growth Promoter Sales by Country (2013-2018)
8.4.2 Middle East & Africa Animal Growth Promoter Sales Market Share by Country (2013-2018)
8.5 Middle East & Africa Animal Growth Promoter Import & Export (2013-2018)
9 Global Animal Growth Promoter Players Profiles/Analysis
9.1 Cargill Animal Health
9.1.1 Company Basic Information, Manufacturing Base, Sales Area and Its Competitors
9.1.2 Animal Growth Promoter Product Types, Application and Specification
9.1.2.1 Product A
9.1.2.2 Product B
9.1.3 Cargill Animal Health Animal Growth Promoter Sales, Revenue, Price and Gross Margin (2013-2018)
9.1.4 Main Business/Business Overview
9.1.5 Cargill Animal Health News
9.2 Royal DSM N.V.
9.2.1 Company Basic Information, Manufacturing Base, Sales Area and Its Competitors
9.2.2 Animal Growth Promoter Product Types, Application and Specification
9.2.2.1 Product A
9.2.2.2 Product B
9.2.3 Royal DSM N.V. Animal Growth Promoter Sales, Revenue, Price and Gross Margin (2013-2018)
9.2.4 Main Business/Business Overview
9.2.5 Royal DSM N.V. News
9.3 Elanco Animal Health
9.3.1 Company Basic Information, Manufacturing Base, Sales Area and Its Competitors
9.3.2 Animal Growth Promoter Product Types, Application and Specification
9.3.2.1 Product A
9.3.2.2 Product B
9.3.3 Elanco Animal Health Animal Growth Promoter Sales, Revenue, Price and Gross Margin (2013-2018)
9.3.4 Main Business/Business Overview
9.3.5 Elanco Animal Health News
9.4 Zoetis, Inc.
9.4.1 Company Basic Information, Manufacturing Base, Sales Area and Its Competitors
9.4.2 Animal Growth Promoter Product Types, Application and Specification
9.4.2.1 Product A
9.4.2.2 Product B
9.4.3 Zoetis, Inc. Animal Growth Promoter Sales, Revenue, Price and Gross Margin (2013-2018)
9.4.4 Main Business/Business Overview
9.4.5 Zoetis, Inc. News
9.5 Alltech, Inc.
9.5.1 Company Basic Information, Manufacturing Base, Sales Area and Its Competitors
9.5.2 Animal Growth Promoter Product Types, Application and Specification
9.5.2.1 Product A
9.5.2.2 Product B
9.5.3 Alltech, Inc. Animal Growth Promoter Sales, Revenue, Price and Gross Margin (2013-2018)
9.5.4 Main Business/Business Overview
9.5.5 Alltech, Inc. News
9.6 Bayer Animal Health
9.6.1 Company Basic Information, Manufacturing Base, Sales Area and Its Competitors
9.6.2 Animal Growth Promoter Product Types, Application and Specification
9.6.2.1 Product A
9.6.2.2 Product B
9.6.3 Bayer Animal Health Animal Growth Promoter Sales, Revenue, Price and Gross Margin (2013-2018)
9.6.4 Main Business/Business Overview
9.6.5 Bayer Animal Health News
9.7 Kemin
9.7.1 Company Basic Information, Manufacturing Base, Sales Area and Its Competitors
9.7.2 Animal Growth Promoter Product Types, Application and Specification
9.7.2.1 Product A
9.7.2.2 Product B
9.7.3 Kemin Animal Growth Promoter Sales, Revenue, Price and Gross Margin (2013-2018)
9.7.4 Main Business/Business Overview
9.7.5 Kemin News
9.8 Yiduoli
9.8.1 Company Basic Information, Manufacturing Base, Sales Area and Its Competitors
9.8.2 Animal Growth Promoter Product Types, Application and Specification
9.8.2.1 Product A
9.8.2.2 Product B
9.8.3 Yiduoli Animal Growth Promoter Sales, Revenue, Price and Gross Margin (2013-2018)
9.8.4 Main Business/Business Overview
9.8.5 Yiduoli News
9.9 DuPont (Danisco)
9.9.1 Company Basic Information, Manufacturing Base, Sales Area and Its Competitors
9.9.2 Animal Growth Promoter Product Types, Application and Specification
9.9.2.1 Product A
9.9.2.2 Product B
9.9.3 DuPont (Danisco) Animal Growth Promoter Sales, Revenue, Price and Gross Margin (2013-2018)
9.9.4 Main Business/Business Overview
9.9.5 DuPont (Danisco) News
9.10 Novozymes
9.10.1 Company Basic Information, Manufacturing Base, Sales Area and Its Competitors
9.10.2 Animal Growth Promoter Product Types, Application and Specification
9.10.2.1 Product A
9.10.2.2 Product B
9.10.3 Novozymes Animal Growth Promoter Sales, Revenue, Price and Gross Margin (2013-2018)
9.10.4 Main Business/Business Overview
9.10.5 Novozymes News
9.11 Merck Animal Health
9.12 Biomin
9.13 Novus International, Inc.
9.14 BASF SE
9.15 Chr.Hansen
10 Global Animal Growth Promoter Market Forecast (2018-2023)
10.1 Global Animal Growth Promoter Sales, Revenue Forecast (2018-2023)
10.2 Global Animal Growth Promoter Sales, Consumption Forecast by Regions (2018-2023)
10.2.1 Global Animal Growth Promoter Sales Forecast by Regions (2018-2023)
10.2.2 Global Animal Growth Promoter Sales Market Share Forecast by Regions (2018-2023)
10.3 Global Animal Growth Promoter Sales and Market Share Forecast by Type (2018-2023)
10.3.1 Global Animal Growth Promoter Sales Forecast by Type (2018-2023)
10.3.2 Global Animal Growth Promoter Sales Market Share Forecast by Type (2018-2023)
10.4 Global Animal Growth Promoter Sales and Market Share Forecast by Application (2018-2023)
10.4.1 Global Animal Growth Promoter Sales Forecast by Application (2018-2023)
10.4.2 Global Animal Growth Promoter Sales Market Share Forecast by Application (2018-2023)
10.5 Animal Growth Promoter Price Forecast (2018-2023)
11 Animal Growth Promoter Manufacturing Cost Analysis
11.1 Animal Growth Promoter Key Raw Materials Analysis
11.1.1 Key Raw Materials
11.1.2 Price Trend of Key Raw Materials
11.1.3 Key Suppliers of Raw Materials
11.1.4 Market Concentration Rate of Raw Materials
11.2 Proportion of Manufacturing Cost Structure
11.2.1 Raw Materials
11.2.2 Labor Cost
11.2.3 Manufacturing Expenses
11.3 Manufacturing Process Analysis of Animal Growth Promoter
12 Industrial Chain, Sourcing Strategy and Downstream Buyers
12.1 Animal Growth Promoter Industrial Chain Analysis
12.2 Upstream Raw Materials Sourcing
12.3 Raw Materials Sources of Animal Growth Promoter Major Players in 2017
12.4 Downstream Buyers
13 Marketing Strategy Analysis, Distributors/Traders
13.1 Marketing Channel
13.1.1 Direct Marketing
13.1.2 Indirect Marketing
13.1.3 Marketing Channel Development Trend
13.2 Market Positioning
13.2.1 Pricing Strategy
13.2.2 Brand Strategy
13.2.3 Target Client
13.3 Distributors/Traders List
14 Market Effect Factors Analysis
14.1 Technology Progress/Risk
14.1.1 Substitutes Threat
14.1.2 Technology Progress in Related Industry
14.2 Consumer Needs/Customer Preference Change
14.3 Economic/Political Environmental Change
15 Research Findings and Conclusion
16 Appendix
16.1 Methodology
16.2 Data Source
List of Tables and Figures
Figure Picture of Animal Growth Promoter
Table Product Specifications of Animal Growth Promoter
Figure Global Sales Market Share of Animal Growth Promoter by Types in 2017
Figure Product Picture of Antibiotic
Table Major Players of Antibiotic
Figure Product Picture of Prebiotics and Probiotics
Table Major Players of Prebiotics and Probiotics
Figure Product Picture of Feed Enzymes
Table Major Players of Feed Enzymes
Figure Product Picture of Others
Table Major Players of Others
Figure Animal Growth Promoter Sales Market Share by Applications in 2017
Table Applications of Animal Growth Promoter
Figure Aquaculture Examples
Figure Poultry Examples
Figure Other Examples
Figure North America Animal Growth Promoter Revenue (Million USD) and Growth Rate (2013-2023)
Figure Asia-Pacific Animal Growth Promoter Revenue (Million USD) and Growth Rate (2013-2023)
Figure Europe Animal Growth Promoter Revenue (Million USD) and Growth Rate (2013-2023)
Figure South America Animal Growth Promoter Revenue (Million USD) and Growth Rate (2013-2023)
Figure Middle East and Africa Animal Growth Promoter Revenue (Million USD) and Growth Rate (2013-2023)
Figure Global Animal Growth Promoter Revenue (Million USD) and Growth Rate (2013-2023)
Table Global Animal Growth Promoter Sales by Players in 2016 and 2017
Table Global Animal Growth Promoter Sales Market Share (%) by Players in 2016 and 2017
Figure Global Animal Growth Promoter Sales Market Share by Players in 2016
Figure Global Animal Growth Promoter Sales Market Share by Players in 2017
Table Global Animal Growth Promoter Revenue by Players in 2016 and 2017
Table Global Animal Growth Promoter Revenue Market Share (%) by Players in 2016 and 2017
Figure Global Animal Growth Promoter Revenue Market Share by Players in 2016
Figure Global Animal Growth Promoter Revenue Market Share by Players in 2017
Table Global Animal Growth Promoter Average Price by Players in 2016 and 2017
Figure Global Animal Growth Promoter Average Price by Players in 2017
Table Global Animal Growth Promoter Manufacturing Base Distribution and Sales Area by Players
Table Players Animal Growth Promoter Product Types
Figure Animal Growth Promoter Market Share of Top 3 Players
Figure Animal Growth Promoter Market Share of Top 5 Players
Table Global Animal Growth Promoter Sales by Regions (2013-2018)
Table Global Animal Growth Promoter Sales Market Share by Regions (2013-2018)
Figure Global Animal Growth Promoter Sales Market Share by Regions (2013-2018)
Figure Global Animal Growth Promoter Sales Market Share by Regions in 2017
Table Global Animal Growth Promoter Revenue by Regions (2013-2018)
Table Global Animal Growth Promoter Revenue Market Share by Regions (2013-2018)
Figure Global Animal Growth Promoter Revenue Market Share by Regions (2013-2018)
Figure Global Animal Growth Promoter Revenue Market Share by Regions in 2017
Table Global Animal Growth Promoter Sales by Type (2013-2018)
Table Global Animal Growth Promoter Sales Market Share by Type (2013-2018)
Figure Global Animal Growth Promoter Sales Market Share by Type (2013-2018)
Figure Global Animal Growth Promoter Sales Market Share by Type in 2017
Table Global Animal Growth Promoter Revenue by Type (2013-2018)
Table Global Animal Growth Promoter Revenue Market Share by Type (2013-2018)
Figure Global Animal Growth Promoter Revenue Market Share by Type (2013-2018)
Figure Global Animal Growth Promoter Revenue Market Share by Type in 2017
Table Global Animal Growth Promoter Price by Type (2013-2018)
Table Global Animal Growth Promoter Sales by Application (2013-2018)
Figure Global Animal Growth Promoter Sales Market Share by Application in 2017
Table Global Animal Growth Promoter Sales Market Share by Application (2013-2018)
Figure Global Animal Growth Promoter Sales Market Share by Application (2013-2018)
Table Global Animal Growth Promoter Sales, Revenue, Price and Gross Margin (2013-2018)
Table North America Top 5 Players Animal Growth Promoter Sales in 2016 and 2017
Table North America Top 5 Players Animal Growth Promoter Sales Market Share (%) in 2016 and 2017
Figure North America Top 5 Players Animal Growth Promoter Sales Share in 2016
Figure North America Top 5 Players Animal Growth Promoter Sales Share in 2017
Table North America Top 5 Players Animal Growth Promoter Revenue in 2016 and 2017
Table North America Top 5 Players Animal Growth Promoter Revenue Market Share (%) in 2016 and 2017
Figure North America Top 5 Players Animal Growth Promoter Revenue Share in 2016
Figure North America Top 5 Players Animal Growth Promoter Revenue Share in 2017
Table North America Animal Growth Promoter Sales by Type (2013-2018)
Figure 2017 North America Animal Growth Promoter Sales Market Share by Type
Table North America Animal Growth Promoter Sales Market Share by Type (2013-2018)
Figure North America Animal Growth Promoter Sales Market Share by Type (2013-2018)
Table North America Animal Growth Promoter Revenue by Type (2013-2018)
Figure North America Animal Growth Promoter Revenue Market Share by Type in 2017
Table North America Animal Growth Promoter Revenue Market Share by Type (2013-2018)
Figure North America Animal Growth Promoter Revenue Market Share by Type (2013-2018)
Table North America Animal Growth Promoter Price by Type (2013-2018)
Table North America Animal Growth Promoter Sales by Application (2013-2018)
Figure North America Animal Growth Promoter Sales by Application in 2017
Table North America Animal Growth Promoter Sales Market Share by Application (2013-2018)
Figure North America Animal Growth Promoter Sales Market Share by Application (2013-2018)
Table North America Animal Growth Promoter Sales by Country (2013-2018)
Figure 2017 North America Animal Growth Promoter Sales Market Share by Country
Table North America Animal Growth Promoter Sales Market Share by Country (2013-2018)
Figure North America Animal Growth Promoter Sales Market Share by Country (2013-2018)
Table North America Animal Growth Promoter Import & Export (2013-2018)
Table Europe Top 5 Players Animal Growth Promoter Sales in 2016 and 2017
Table Europe Top 5 Players Animal Growth Promoter Sales Market Share (%) in 2016 and 2017
Figure Europe Top 5 Players Animal Growth Promoter Sales Share in 2016
Figure Europe Top 5 Players Animal Growth Promoter Sales Share in 2017
Table Europe Top 5 Players Animal Growth Promoter Revenue in 2016 and 2017
Table Europe Top 5 Players Animal Growth Promoter Revenue Market Share (%) in 2016 and 2017
Figure Europe Top 5 Players Animal Growth Promoter Revenue Share in 2016
Figure Europe Top 5 Players Animal Growth Promoter Revenue Share in 2017
Table Europe Animal Growth Promoter Sales by Type (2013-2018)
Figure 2017 Europe Animal Growth Promoter Sales Market Share by Type
Table Europe Animal Growth Promoter Sales Market Share by Type (2013-2018)
Figure Europe Animal Growth Promoter Sales Market Share by Type (2013-2018)
Table Europe Animal Growth Promoter Revenue by Type (2013-2018)
Figure Europe Animal Growth Promoter Revenue Market Share by Type in 2017
Table Europe Animal Growth Promoter Revenue Market Share by Type (2013-2018)
Figure Europe Animal Growth Promoter Revenue Market Share by Type (2013-2018)
Table Europe Animal Growth Promoter Price by Type (2013-2018)
Table Europe Animal Growth Promoter Sales by Application (2013-2018)
Figure Europe Animal Growth Promoter Sales Market Share by Application in 2017
Table Europe Animal Growth Promoter Sales Market Share by Application (2013-2018)
Figure Europe Animal Growth Promoter Sales Market Share by Application (2013-2018)
Table Europe Animal Growth Promoter Sales by Country (2013-2018)
Figure Europe Animal Growth Promoter Sales Market Share by Country in 2017
Table Europe Animal Growth Promoter Sales Market Share by Country (2013-2018)
Figure Europe Animal Growth Promoter Sales Market Share by Country (2013-2018)
Table Europe Animal Growth Promoter Import & Export (2013-2018)
Table Asia-Pacific Top 5 Players Animal Growth Promoter Sales in 2016 and 2017
Table Asia-Pacific Top 5 Players Animal Growth Promoter Sales Market Share (%) in 2016 and 2017
Figure Asia-Pacific Top 5 Players Animal Growth Promoter Sales Share in 2016
Figure Asia-Pacific Top 5 Players Animal Growth Promoter Sales Share in 2017
Table Asia-Pacific Top 5 Players Animal Growth Promoter Revenue in 2016 and 2017
Table Asia-Pacific Top 5 Players Animal Growth Promoter Revenue Market Share (%) in 2016 and 2017
Figure Asia-Pacific Top 5 Players Animal Growth Promoter Revenue Share in 2016
Figure Asia-Pacific Top 5 Players Animal Growth Promoter Revenue Share in 2017
Table Asia-Pacific Animal Growth Promoter Sales by Type (2013-2018)
Figure Asia-Pacific Animal Growth Promoter Sales Market Share by Type in 2017
Table Asia-Pacific Animal Growth Promoter Sales Market Share by Type (2013-2018)
Figure Asia-Pacific Animal Growth Promoter Sales Market Share by Type (2013-2018)
Table Asia-Pacific Animal Growth Promoter Revenue by Type (2013-2018)
Table Asia-Pacific Animal Growth Promoter Revenue Market Share by Type (2013-2018)
Figure Asia-Pacific Animal Growth Promoter Revenue Market Share by Type (2013-2018)
Figure Asia-Pacific Animal Growth Promoter Revenue Market Share by Type in 2017
Table Asia-Pacific Animal Growth Promoter Price by Type (2013-2018)
Table Asia-Pacific Animal Growth Promoter Sales by Application (2013-2018)
Figure Asia-Pacific Animal Growth Promoter Sales by Application in 2017
Table Asia-Pacific Animal Growth Promoter Sales Market Share by Application (2013-2018)
Figure Asia-Pacific Animal Growth Promoter Sales Market Share by Application (2013-2018)
Table Asia-Pacific Animal Growth Promoter Sales by Country (2013-2018)
Figure Asia-Pacific Animal Growth Promoter Sales Market Share by Country in 2017
Table Asia-Pacific Animal Growth Promoter Sales Market Share by Country (2013-2018)
Figure Asia-Pacific Animal Growth Promoter Sales Market Share by Country (2013-2018)
Table Asia-Pacific Animal Growth Promoter Import & Export (2013-2018)
Table South America Top 5 Players Animal Growth Promoter Sales in 2016 and 2017
Table South America Top 5 Players Animal Growth Promoter Sales Market Share (%) in 2016 and 2017
Figure South America Top 5 Players Animal Growth Promoter Sales Share in 2016
Figure South America Top 5 Players Animal Growth Promoter Sales Share in 2017
Table South America Top 5 Players Animal Growth Promoter Revenue in 2016 and 2017
Table South America Top 5 Players Animal Growth Promoter Revenue Market Share (%) in 2016 and 2017
Figure South America Top 5 Players Animal Growth Promoter Revenue Share in 2016
Figure South America Top 5 Players Animal Growth Promoter Revenue Share in 2017
Table South America Animal Growth Promoter Sales by Type (2013-2018)
Figure South America Animal Growth Promoter Sales by Type in 2017
Table South America Animal Growth Promoter Sales Market Share by Type (2013-2018)
Figure South America Animal Growth Promoter Sales Market Share by Type (2013-2018)
Table South America Animal Growth Promoter Revenue by Type (2013-2018)
Figure South America Animal Growth Promoter Revenue by Type in 2017
Table South America Animal Growth Promoter Revenue Market Share by Type (2013-2018)
Figure South America Animal Growth Promoter Revenue Market Share by Type (2013-2018)
Table South America Animal Growth Promoter Price by Type (2013-2018)
Table South America Animal Growth Promoter Sales by Application (2013-2018)
Figure South America Animal Growth Promoter Sales by Application in 2017
Table South America Animal Growth Promoter Sales Market Share by Application (2013-2018)
Figure South America Animal Growth Promoter Sales Market Share by Application (2013-2018)
Table South America Animal Growth Promoter Sales by Country (2013-2018)
Figure South America Animal Growth Promoter Sales by Country in 2017
Table South America Animal Growth Promoter Sales Market Share by Country (2013-2018)
Figure South America Animal Growth Promoter Sales Market Share by Country (2013-2018)
Table South America Animal Growth Promoter Import & Export (2013-2018)
Table Middle East & Africa Top 5 Players Animal Growth Promoter Sales in 2016 and 2017
Table Middle East & Africa Top 5 Players Animal Growth Promoter Sales Market Share (%) in 2016 and 2017
Figure Middle East & Africa Top 5 Players Animal Growth Promoter Sales Share in 2016
Figure Middle East & Africa Top 5 Players Animal Growth Promoter Sales Share in 2017
Table Middle East & Africa Top 5 Players Animal Growth Promoter Revenue in 2016 and 2017
Table Middle East & Africa Top 5 Players Animal Growth Promoter Revenue Market Share (%) in 2016 and 2017
Figure Middle East & Africa Top 5 Players Animal Growth Promoter Revenue Share in 2016
Figure Middle East & Africa Top 5 Players Animal Growth Promoter Revenue Share in 2017
Table Middle East & Africa Animal Growth Promoter Sales by Type (2013-2018)
Figure Middle East & Africa Animal Growth Promoter Sales by Type in 2017
Table Middle East & Africa Animal Growth Promoter Sales Market Share by Type (2013-2018)
Figure Middle East & Africa Animal Growth Promoter Sales Market Share by Type (2013-2018)
Table Middle East & Africa Animal Growth Promoter Revenue by Type (2013-2018)
Figure Middle East & Africa Animal Growth Promoter Revenue by Type in 2017
Table Middle East & Africa Animal Growth Promoter Revenue Market Share by Type (2013-2018)
Figure Middle East & Africa Animal Growth Promoter Revenue Market Share by Type (2013-2018)
Table Middle East & Africa Animal Growth Promoter Price by Type (2013-2018)
Table Middle East & Africa Animal Growth Promoter Sales by Application (2013-2018)
Figure Middle East & Africa Animal Growth Promoter Sales by Application in 2017
Table Middle East & Africa Animal Growth Promoter Sales Market Share by Application (2013-2018)
Figure Middle East & Africa Animal Growth Promoter Sales Market Share by Application (2013-2018)
Table Middle East & Africa Animal Growth Promoter Sales by Country (2013-2018)
Figure Middle East & Africa Animal Growth Promoter Sales by Country in 2017
Table Middle East & Africa Animal Growth Promoter Sales Market Share by Country (2013-2018)
Table Cargill Animal Health Animal Growth Promoter Sales, Revenue, Price and Gross Margin (2013-2018)
Table Middle East & Africa Animal Growth Promoter Import & Export (2013-2018)
Table Cargill Animal Health Basic Information, Manufacturing Base, Sales Area and Its Competitors
Table Cargill Animal Health Animal Growth Promoter Sales, Revenue, Price and Gross Margin (2013-2018)
Figure Cargill Animal Health Animal Growth Promoter Market Share (2013-2018)
Table Royal DSM N.V. Basic Information, Manufacturing Base, Sales Area and Its Competitors
Table Royal DSM N.V. Animal Growth Promoter Sales, Revenue, Price and Gross Margin (2013-2018)
Figure Royal DSM N.V. Animal Growth Promoter Market Share (2013-2018)
Table Elanco Animal Health Basic Information, Manufacturing Base, Sales Area and Its Competitors
Table Elanco Animal Health Animal Growth Promoter Sales, Revenue, Price and Gross Margin (2013-2018)
Figure Elanco Animal Health Animal Growth Promoter Market Share (2013-2018)
Table Zoetis, Inc. Basic Information, Manufacturing Base, Sales Area and Its Competitors
Table Zoetis, Inc. Animal Growth Promoter Sales, Revenue, Price and Gross Margin (2013-2018)
Figure Zoetis, Inc. Animal Growth Promoter Market Share (2013-2018)
Table Alltech, Inc. Basic Information, Manufacturing Base, Sales Area and Its Competitors
Table Alltech, Inc. Animal Growth Promoter Sales, Revenue, Price and Gross Margin (2013-2018)
Figure Alltech, Inc. Animal Growth Promoter Market Share (2013-2018)
Table Bayer Animal Health Basic Information, Manufacturing Base, Sales Area and Its Competitors
Table Bayer Animal Health Animal Growth Promoter Sales, Revenue, Price and Gross Margin (2013-2018)
Figure Bayer Animal Health Animal Growth Promoter Market Share (2013-2018)
Table Kemin Basic Information, Manufacturing Base, Sales Area and Its Competitors
Table Kemin Animal Growth Promoter Sales, Revenue, Price and Gross Margin (2013-2018)
Figure Kemin Animal Growth Promoter Market Share (2013-2018)
Table Yiduoli Basic Information, Manufacturing Base, Sales Area and Its Competitors
Table Yiduoli Animal Growth Promoter Sales, Revenue, Price and Gross Margin (2013-2018)
Figure Yiduoli Animal Growth Promoter Market Share (2013-2018)
Table DuPont (Danisco) Basic Information, Manufacturing Base, Sales Area and Its Competitors
Table DuPont (Danisco) Animal Growth Promoter Sales, Revenue, Price and Gross Margin (2013-2018)
Figure DuPont (Danisco) Animal Growth Promoter Market Share (2013-2018)
Table Novozymes Basic Information, Manufacturing Base, Sales Area and Its Competitors
Table Novozymes Animal Growth Promoter Sales, Revenue, Price and Gross Margin (2013-2018)
Figure Novozymes Animal Growth Promoter Market Share (2013-2018)
Table Merck Animal Health Basic Information, Manufacturing Base, Sales Area and Its Competitors
Table Biomin Basic Information, Manufacturing Base, Sales Area and Its Competitors
Table Novus International, Inc. Basic Information, Manufacturing Base, Sales Area and Its Competitors
Table BASF SE Basic Information, Manufacturing Base, Sales Area and Its Competitors
Table Chr.Hansen Basic Information, Manufacturing Base, Sales Area and Its Competitors
Figure Global Animal Growth Promoter Sales and Growth Rate Forecast (2018-2023)
Figure Global Animal Growth Promoter Revenue and Growth Rate Forecast (2018-2023)
Table Global Animal Growth Promoter Sales Forecast by Regions (2018-2023)
Table Global Animal Growth Promoter Sales Market Share Forecast by Regions (2018-2023)
Table Global Animal Growth Promoter Sales Forecast by Type (2018-2023)
Table Global Animal Growth Promoter Sales Market Share Forecast by Type (2018-2023)
Table Global Animal Growth Promoter Sales Forecast by Application (2018-2023)
Table Global Animal Growth Promoter Sales Market Share Forecast by Application (2018-2023)
Table Sales Base and Market Concentration Rate of Raw Material
Figure Price Trend of Key Raw Materials
Table Key Suppliers of Raw Materials
Figure Manufacturing Cost Structure of Animal Growth Promoter
Figure Manufacturing Process Analysis of Animal Growth Promoter
Figure Animal Growth Promoter Industrial Chain Analysis
Table Raw Materials Sources of Animal Growth Promoter Major Players in 2017
Table Major Buyers of Animal Growth Promoter
Table Distributors/Traders List
*If Applicable.