

1 Haptics Technology Market Overview
1.1 Product Overview and Scope of Haptics Technology
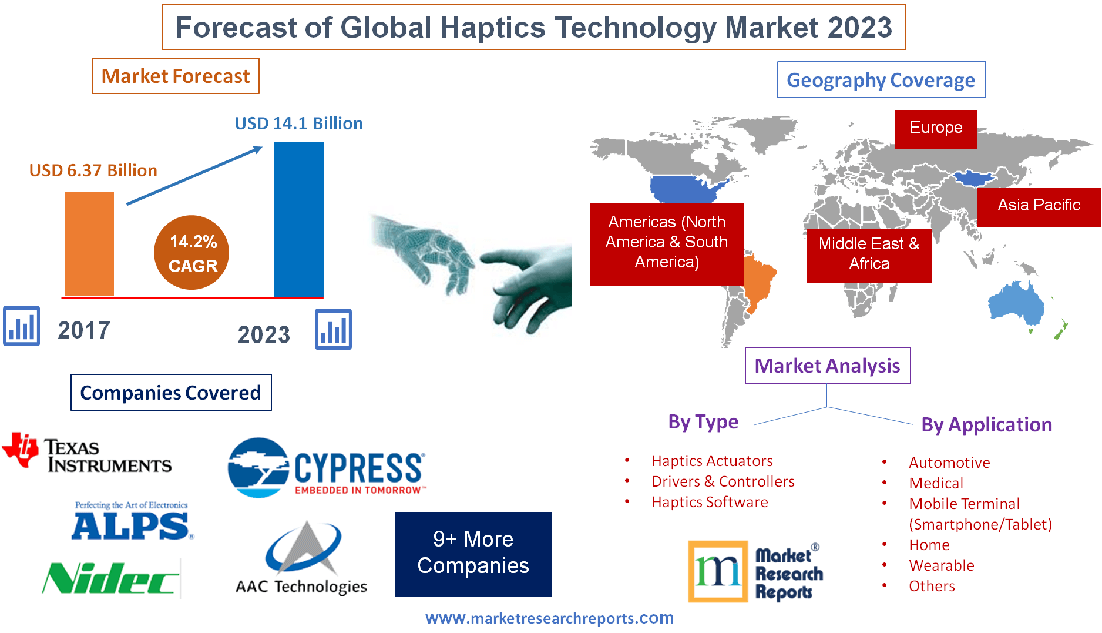
1.2 Haptics Technology Segment by Types
1.2.1 Global Sales Market Share of Haptics Technology by Types in 2017
1.2.2 Haptics Actuators
1.2.2.1 Major Players of Type I
1.2.3 Drivers & Controllers
1.2.3.1 Major Players of Drivers & Controllers
1.2.4 Haptics Software
1.2.4.1 Major Players of Haptics Software
1.3 Haptics Technology Segment by Applications
1.3.1 Haptics Technology Sales Market Share by Applications in 2017
1.3.2 Automotive
1.3.3 Medical
1.3.4 Mobile Terminal (Smartphone/Tablet)
1.3.5 Home
1.3.6 Wearable
1.3.7 Others
1.4 Haptics Technology Market by Regions
1.4.1 North America Status and Prospect (2013-2023)
1.4.1.1 North America Haptics Technology Revenue (Million USD) and Growth Rate (2013-2023)
1.4.2 Asia-Pacific Status and Prospect (2013-2023)
1.4.2.1 Asia-Pacific Haptics Technology Revenue (Million USD) and Growth Rate (2013-2023)
1.4.3 Europe Status and Prospect (2013-2023)
1.4.3.1 Europe Haptics Technology Revenue (Million USD) and Growth Rate (2013-2023)
1.4.4 South America Status and Prospect (2013-2023)
1.4.4.1 South America Haptics Technology Revenue (Million USD) and Growth Rate (2013-2023)
1.4.5 Middle East and Africa Status and Prospect (2013-2023)
1.4.5.1 Middle East and Africa Haptics Technology Revenue (Million USD) and Growth Rate (2013-2023)
1.5 Global Market Size (Value) of Haptics Technology (2013-2023)
2 Global Haptics Technology Sales, Revenue (Value) and Market Share by Players
2.1 Global Haptics Technology Sales and Market Share by Players in 2016 and 2017
2.1.1 Global Haptics Technology Sales by Players in 2016 and 2017
2.1.2 Global Haptics Technology Sales Market Share (%) by Players in 2016 and 2017
2.2 Global Haptics Technology Revenue and Market Share by Players in 2016 and 2017
2.2.1 Global Haptics Technology Revenue by Players in 2016 and 2017
2.2.2 Global Haptics Technology Revenue Market Share (%) by Players in 2016 and 2017
2.3 Global Haptics Technology Average Price by Players in 2016 and 2017
2.4 Global Haptics Technology Manufacturing Base Distribution, Sales Area, Product Types by Players
2.4.1 Global Haptics Technology Manufacturing Base Distribution and Sales Area by Players
2.4.2 Players Haptics Technology Product Types
2.5 Haptics Technology Market Competitive Situation and Trends
2.5.1 Haptics Technology Market Concentration Rate
2.5.2 Haptics Technology Market Share of Top 3 and Top 5 Players
2.5.3 Mergers & Acquisitions, Expansion
3 Global Haptics Technology Sales, Revenue (Value) by Regions, Type and Application (2013-2018)
3.1 Global Haptics Technology Sales, Revenue and Market Share by Regions (2013-2018)
3.1.1 Global Haptics Technology Sales and Market Share by Regions (2013-2018)
3.1.2 Global Haptics Technology Revenue and Market Share by Regions (2013-2018)
3.2 Global Haptics Technology Sales, Revenue, Market Share and Price by Type (2013-2018)
3.2.1 Global Haptics Technology Sales and Market Share by Type (2013-2018)
3.2.2 Global Haptics Technology Revenue and Market Share by Type (2013-2018)
3.2.3 Global Haptics Technology Price by Type (2013-2018)
3.3 Global Haptics Technology Sales and Market Share by Application (2013-2018)
3.3.1 Global Haptics Technology Sales by Application (2013-2018)
3.3.2 Global Haptics Technology Sales Market Share by Application (2013-2018)
3.4 Global Haptics Technology Sales, Revenue, Price and Gross Margin (2013-2018)
4 North America Top 5 Players Haptics Technology Sales, Revenue and Price
4.1 North America Top 5 Players Haptics Technology Sales, Revenue and Market Share in 2016 and 2017
4.1.1 North America Top 5 Players Haptics Technology Sales and Market Share in 2016 and 2017
4.1.2 North America Top 5 Players Haptics Technology Revenue and Market Share in 2016 and 2017
4.2 North America Haptics Technology Sales, Revenue, Market Share and Price by Type (2013-2018)
4.2.1 North America Haptics Technology Sales and Market Share by Type (2013-2018)
4.2.1.1 North America Haptics Technology Sales by Type (2013-2018)
4.2.1.2 North America Haptics Technology Sales Market Share by Type (2013-2018)
4.2.2 North America Haptics Technology Revenue and Market Share by Type (2013-2018)
4.2.2.1 North America Haptics Technology Revenue by Type (2013-2018)
4.2.2.2 North America Haptics Technology Revenue Market Share by Type (2013-2018)
4.2.3 North America Haptics Technology Price by Type (2013-2018)
4.3 North America Haptics Technology Sales and Market Share by Application (2013-2018)
4.3.1 North America Haptics Technology Sales by Application (2013-2018)
4.3.2 North America Haptics Technology Sales Market Share by Application (2013-2018)
4.4 North America Haptics Technology Sales and Market Share by Country (US, Canada and Mexico) (2013-2018)
4.4.1 North America Haptics Technology Sales by Country (2013-2018)
4.4.2 North America Haptics Technology Sales Market Share by Country (2013-2018)
4.5 North America Haptics Technology Import & Export (2013-2018)
5 Europe Top 5 Players Haptics Technology Sales, Revenue and Price
5.1 Europe Top 5 Players Haptics Technology Sales, Revenue and Market Share in 2016 and 2017
5.1.1 Europe Top 5 Players Haptics Technology Sales and Market Share in 2016 and 2017
5.1.2 Europe Top 5 Players Haptics Technology Revenue and Market Share in 2016 and 2017
5.2 Europe Haptics Technology Sales, Revenue, Market Share and Price by Type (2013-2018)
5.2.1 Europe Haptics Technology Sales and Market Share by Type (2013-2018)
5.2.1.1 Europe Haptics Technology Sales by Type (2013-2018)
5.2.1.2 Europe Haptics Technology Sales Market Share by Type (2013-2018)
5.2.2 Europe Haptics Technology Revenue and Market Share by Type (2013-2018)
5.2.2.1 Europe Haptics Technology Revenue by Type (2013-2018)
5.2.2.2 Europe Haptics Technology Revenue Market Share by Type (2013-2018)
5.2.3 Europe Haptics Technology Price by Type (2013-2018)
5.3 Europe Haptics Technology Sales and Market Share by Application (2013-2018)
5.3.1 Europe Haptics Technology Sales by Application (2013-2018)
5.3.2 Europe Haptics Technology Sales Market Share by Application (2013-2018)
5.4 Europe Haptics Technology Sales and Market Share by Country (Germany, UK, France, Italy and Russia) (2013-2018)
5.4.1 Europe Haptics Technology Sales by Country (2013-2018)
5.4.2 Europe Haptics Technology Sales Market Share by Country (2013-2018)
5.5 Europe Haptics Technology Import & Export (2013-2018)
6 Asia-Pacific Top 5 Players Haptics Technology Sales, Revenue and Price
6.1 Asia-Pacific Top 5 Players Haptics Technology Sales, Revenue and Market Share in 2016 and 2017
6.1.1 Asia-Pacific Top 5 Players Haptics Technology Sales and Market Share in 2016 and 2017
6.1.2 Asia-Pacific Top 5 Players Haptics Technology Revenue and Market Share in 2016 and 2017
6.2 Asia-Pacific Haptics Technology Sales, Revenue, Market Share and Price by Type (2013-2018)
6.2.1 Asia-Pacific Haptics Technology Sales and Market Share by Type (2013-2018)
6.2.1.1 Asia-Pacific Haptics Technology Sales by Type (2013-2018)
6.2.1.2 Asia-Pacific Haptics Technology Sales Market Share by Type (2013-2018)
6.2.2 Asia-Pacific Haptics Technology Revenue and Market Share by Type (2013-2018)
6.2.3 Asia-Pacific Haptics Technology Price by Type (2013-2018)
6.3 Asia-Pacific Haptics Technology Sales and Market Share by Application (2013-2018)
6.3.1 Asia-Pacific Haptics Technology Sales by Application (2013-2018)
6.3.2 Asia-Pacific Haptics Technology Sales Market Share by Application (2013-2018)
6.4 Asia-Pacific Haptics Technology Sales and Market Share by Country (China, Japan, Southeast Asia, India, Korea and Australia) (2013-2018)
6.4.1 Asia-Pacific Haptics Technology Sales by Country (2013-2018)
6.4.2 Asia-Pacific Haptics Technology Sales Market Share by Country (2013-2018)
6.5 Asia-Pacific Haptics Technology Import & Export (2013-2018)
7 South America Top 5 Players Haptics Technology Sales, Revenue and Price
7.1 South America Top 5 Players Haptics Technology Sales, Revenue and Market Share in 2016 and 2017
7.1.1 South America Top 5 Players Haptics Technology Sales and Market Share in 2016 and 2017
7.1.2 South America Top 5 Players Haptics Technology Revenue and Market Share in 2016 and 2017
7.2 South America Haptics Technology Sales, Revenue, Market Share and Price by Type (2013-2018)
7.2.1 South America Haptics Technology Sales and Market Share by Type (2013-2018)
7.2.1.1 South America Haptics Technology Sales by Type (2013-2018)
7.2.1.2 South America Haptics Technology Sales Market Share by Type (2013-2018)
7.2.2 South America Haptics Technology Revenue and Market Share by Type (2013-2018)
7.2.2.1 South America Haptics Technology Revenue by Type (2013-2018)
7.2.2.2 South America Haptics Technology Revenue and Market Share by Type (2013-2018)
7.2.3 South America Haptics Technology Price by Type (2013-2018)
7.3 South America Haptics Technology Sales and Market Share by Application (2013-2018)
7.3.1 South America Haptics Technology Sales by Application (2013-2018)
7.3.2 South America Haptics Technology Sales Market Share by Application (2013-2018)
7.4 South America Haptics Technology Sales and Market Share by Country (Brazil, Argentina, Chile and Peru) (2013-2018)
7.4.1 South America Haptics Technology Sales by Country (2013-2018)
7.4.2 South America Haptics Technology Sales Market Share by Country (2013-2018)
7.5 South America Haptics Technology Import & Export (2013-2018)
8 Middle East & Africa Top 5 Players Haptics Technology Sales, Revenue and Price
8.1 Middle East & Africa Top 5 Players Haptics Technology Sales, Revenue and Market Share in 2016 and 2017
8.1.1 Middle East & Africa Top 5 Players Haptics Technology Sales and Market Share in 2016 and 2017
8.1.2 Middle East & Africa Top 5 Players Haptics Technology Revenue and Market Share in 2016 and 2017
8.2 Middle East & Africa Haptics Technology Sales, Revenue, Market Share and Price by Type (2013-2018)
8.2.1 Middle East & Africa Haptics Technology Sales and Market Share by Type (2013-2018)
8.2.1.1 Middle East & Africa Haptics Technology Sales by Type (2013-2018)
8.2.1.2 Middle East & Africa Haptics Technology Sales Market Share by Type (2013-2018)
8.2.2 Middle East & Africa Haptics Technology Revenue and Market Share by Type (2013-2018)
8.2.2.1 Middle East & Africa Haptics Technology Revenue by Type (2013-2018)
8.2.2.2 Middle East & Africa Haptics Technology Revenue Market Share by Type (2013-2018)
8.2.3 Middle East & Africa Haptics Technology Price by Type (2013-2018)
8.3 Middle East & Africa Haptics Technology Sales and Market Share by Application (2013-2018)
8.3.1 Middle East & Africa Haptics Technology Sales by Application (2013-2018)
8.3.2 Middle East & Africa Haptics Technology Sales Market Share by Application (2013-2018)
8.4 Middle East & Africa Haptics Technology Sales and Market Share by Country (Egypt, Saudi Arabia, South Africa and Iran) (2013-2018)
8.4.1 Middle East & Africa Haptics Technology Sales by Country (2013-2018)
8.4.2 Middle East & Africa Haptics Technology Sales Market Share by Country (2013-2018)
8.5 Middle East & Africa Haptics Technology Import & Export (2013-2018)
9 Global Haptics Technology Players Profiles/Analysis
9.1 AAC Technologies
9.1.1 Company Basic Information, Manufacturing Base, Sales Area and Its Competitors
9.1.2 Haptics Technology Product Types, Application and Specification
9.1.2.1 Product A
9.1.2.2 Product B
9.1.3 AAC Technologies Haptics Technology Sales, Revenue, Price and Gross Margin (2013-2018)
9.1.4 Main Business/Business Overview
9.1.5 AAC Technologies News
9.2 Alps Electric
9.2.1 Company Basic Information, Manufacturing Base, Sales Area and Its Competitors
9.2.2 Haptics Technology Product Types, Application and Specification
9.2.2.1 Product A
9.2.2.2 Product B
9.2.3 Alps Electric Haptics Technology Sales, Revenue, Price and Gross Margin (2013-2018)
9.2.4 Main Business/Business Overview
9.2.5 Alps Electric News
9.3 Nidec Corporation
9.3.1 Company Basic Information, Manufacturing Base, Sales Area and Its Competitors
9.3.2 Haptics Technology Product Types, Application and Specification
9.3.2.1 Product A
9.3.2.2 Product B
9.3.3 Nidec Corporation Haptics Technology Sales, Revenue, Price and Gross Margin (2013-2018)
9.3.4 Main Business/Business Overview
9.3.5 Nidec Corporation News
9.4 Cypress Semiconductor
9.4.1 Company Basic Information, Manufacturing Base, Sales Area and Its Competitors
9.4.2 Haptics Technology Product Types, Application and Specification
9.4.2.1 Product A
9.4.2.2 Product B
9.4.3 Cypress Semiconductor Haptics Technology Sales, Revenue, Price and Gross Margin (2013-2018)
9.4.4 Main Business/Business Overview
9.4.5 Cypress Semiconductor News
9.5 Texas Instruments
9.5.1 Company Basic Information, Manufacturing Base, Sales Area and Its Competitors
9.5.2 Haptics Technology Product Types, Application and Specification
9.5.2.1 Product A
9.5.2.2 Product B
9.5.3 Texas Instruments Haptics Technology Sales, Revenue, Price and Gross Margin (2013-2018)
9.5.4 Main Business/Business Overview
9.5.5 Texas Instruments News
9.6 Bluecom
9.6.1 Company Basic Information, Manufacturing Base, Sales Area and Its Competitors
9.6.2 Haptics Technology Product Types, Application and Specification
9.6.2.1 Product A
9.6.2.2 Product B
9.6.3 Bluecom Haptics Technology Sales, Revenue, Price and Gross Margin (2013-2018)
9.6.4 Main Business/Business Overview
9.6.5 Bluecom News
9.7 On Semiconductor
9.7.1 Company Basic Information, Manufacturing Base, Sales Area and Its Competitors
9.7.2 Haptics Technology Product Types, Application and Specification
9.7.2.1 Product A
9.7.2.2 Product B
9.7.3 On Semiconductor Haptics Technology Sales, Revenue, Price and Gross Margin (2013-2018)
9.7.4 Main Business/Business Overview
9.7.5 On Semiconductor News
9.8 Microchip
9.8.1 Company Basic Information, Manufacturing Base, Sales Area and Its Competitors
9.8.2 Haptics Technology Product Types, Application and Specification
9.8.2.1 Product A
9.8.2.2 Product B
9.8.3 Microchip Haptics Technology Sales, Revenue, Price and Gross Margin (2013-2018)
9.8.4 Main Business/Business Overview
9.8.5 Microchip News
9.9 Johnson Electric
9.9.1 Company Basic Information, Manufacturing Base, Sales Area and Its Competitors
9.9.2 Haptics Technology Product Types, Application and Specification
9.9.2.1 Product A
9.9.2.2 Product B
9.9.3 Johnson Electric Haptics Technology Sales, Revenue, Price and Gross Margin (2013-2018)
9.9.4 Main Business/Business Overview
9.9.5 Johnson Electric News
9.10 Immersion
9.10.1 Company Basic Information, Manufacturing Base, Sales Area and Its Competitors
9.10.2 Haptics Technology Product Types, Application and Specification
9.10.2.1 Product A
9.10.2.2 Product B
9.10.3 Immersion Haptics Technology Sales, Revenue, Price and Gross Margin (2013-2018)
9.10.4 Main Business/Business Overview
9.10.5 Immersion News
9.11 Jinlong Machinery & Electronics
9.12 Precision Microdrives
9.13 Novasentis
10 Global Haptics Technology Market Forecast (2018-2023)
10.1 Global Haptics Technology Sales, Revenue Forecast (2018-2023)
10.2 Global Haptics Technology Sales, Consumption Forecast by Regions (2018-2023)
10.2.1 Global Haptics Technology Sales Forecast by Regions (2018-2023)
10.2.2 Global Haptics Technology Sales Market Share Forecast by Regions (2018-2023)
10.3 Global Haptics Technology Sales and Market Share Forecast by Type (2018-2023)
10.3.1 Global Haptics Technology Sales Forecast by Type (2018-2023)
10.3.2 Global Haptics Technology Sales Market Share Forecast by Type (2018-2023)
10.4 Global Haptics Technology Sales and Market Share Forecast by Application (2018-2023)
10.4.1 Global Haptics Technology Sales Forecast by Application (2018-2023)
10.4.2 Global Haptics Technology Sales Market Share Forecast by Application (2018-2023)
10.5 Haptics Technology Price Forecast (2018-2023)
11 Haptics Technology Manufacturing Cost Analysis
11.1 Haptics Technology Key Raw Materials Analysis
11.1.1 Key Raw Materials
11.1.2 Price Trend of Key Raw Materials
11.1.3 Key Suppliers of Raw Materials
11.1.4 Market Concentration Rate of Raw Materials
11.2 Proportion of Manufacturing Cost Structure
11.2.1 Raw Materials
11.2.2 Labor Cost
11.2.3 Manufacturing Expenses
11.3 Manufacturing Process Analysis of Haptics Technology
12 Industrial Chain, Sourcing Strategy and Downstream Buyers
12.1 Haptics Technology Industrial Chain Analysis
12.2 Upstream Raw Materials Sourcing
12.3 Raw Materials Sources of Haptics Technology Major Players in 2017
12.4 Downstream Buyers
13 Marketing Strategy Analysis, Distributors/Traders
13.1 Marketing Channel
13.1.1 Direct Marketing
13.1.2 Indirect Marketing
13.1.3 Marketing Channel Development Trend
13.2 Market Positioning
13.2.1 Pricing Strategy
13.2.2 Brand Strategy
13.2.3 Target Client
13.3 Distributors/Traders List
14 Market Effect Factors Analysis
14.1 Technology Progress/Risk
14.1.1 Substitutes Threat
14.1.2 Technology Progress in Related Industry
14.2 Consumer Needs/Customer Preference Change
14.3 Economic/Political Environmental Change
15 Research Findings and Conclusion
16 Appendix
16.1 Methodology
16.2 Data Source
List of Tables and Figures
Figure Picture of Haptics Technology
Table Product Specifications of Haptics Technology
Figure Global Sales Market Share of Haptics Technology by Types in 2017
Figure Product Picture of Haptics Actuators
Table Major Players of Haptics Actuators
Figure Product Picture of Drivers & Controllers
Table Major Players of Drivers & Controllers
Figure Product Picture of Haptics Software
Table Major Players of Haptics Software
Figure Haptics Technology Sales Market Share by Applications in 2017
Table Applications of Haptics Technology
Figure Medical Examples
Figure Mobile Terminal (Smartphone/Tablet) Examples
Figure Home Examples
Figure Wearable Examples
Figure Others Examples
Figure North America Haptics Technology Revenue (Million USD) and Growth Rate (2013-2023)
Figure Asia-Pacific Haptics Technology Revenue (Million USD) and Growth Rate (2013-2023)
Figure Europe Haptics Technology Revenue (Million USD) and Growth Rate (2013-2023)
Figure South America Haptics Technology Revenue (Million USD) and Growth Rate (2013-2023)
Figure Middle East and Africa Haptics Technology Revenue (Million USD) and Growth Rate (2013-2023)
Figure Global Haptics Technology Revenue (Million USD) and Growth Rate (2013-2023)
Table Global Haptics Technology Sales by Players in 2016 and 2017
Table Global Haptics Technology Sales Market Share (%) by Players in 2016 and 2017
Figure Global Haptics Technology Sales Market Share by Players in 2016
Figure Global Haptics Technology Sales Market Share by Players in 2017
Table Global Haptics Technology Revenue by Players in 2016 and 2017
Table Global Haptics Technology Revenue Market Share (%) by Players in 2016 and 2017
Figure Global Haptics Technology Revenue Market Share by Players in 2016
Figure Global Haptics Technology Revenue Market Share by Players in 2017
Table Global Haptics Technology Average Price by Players in 2016 and 2017
Figure Global Haptics Technology Average Price by Players in 2017
Table Global Haptics Technology Manufacturing Base Distribution and Sales Area by Players
Table Players Haptics Technology Product Types
Figure Haptics Technology Market Share of Top 3 Players
Figure Haptics Technology Market Share of Top 5 Players
Table Global Haptics Technology Sales by Regions (2013-2018)
Table Global Haptics Technology Sales Market Share by Regions (2013-2018)
Figure Global Haptics Technology Sales Market Share by Regions (2013-2018)
Figure Global Haptics Technology Sales Market Share by Regions in 2017
Table Global Haptics Technology Revenue by Regions (2013-2018)
Table Global Haptics Technology Revenue Market Share by Regions (2013-2018)
Figure Global Haptics Technology Revenue Market Share by Regions (2013-2018)
Figure Global Haptics Technology Revenue Market Share by Regions in 2017
Table Global Haptics Technology Sales by Type (2013-2018)
Table Global Haptics Technology Sales Market Share by Type (2013-2018)
Figure Global Haptics Technology Sales Market Share by Type (2013-2018)
Figure Global Haptics Technology Sales Market Share by Type in 2017
Table Global Haptics Technology Revenue by Type (2013-2018)
Table Global Haptics Technology Revenue Market Share by Type (2013-2018)
Figure Global Haptics Technology Revenue Market Share by Type (2013-2018)
Figure Global Haptics Technology Revenue Market Share by Type in 2017
Table Global Haptics Technology Price by Type (2013-2018)
Table Global Haptics Technology Sales by Application (2013-2018)
Figure Global Haptics Technology Sales Market Share by Application in 2017
Table Global Haptics Technology Sales Market Share by Application (2013-2018)
Figure Global Haptics Technology Sales Market Share by Application (2013-2018)
Table Global Haptics Technology Sales, Revenue, Price and Gross Margin (2013-2018)
Table North America Top 5 Players Haptics Technology Sales in 2016 and 2017
Table North America Top 5 Players Haptics Technology Sales Market Share (%) in 2016 and 2017
Figure North America Top 5 Players Haptics Technology Sales Share in 2016
Figure North America Top 5 Players Haptics Technology Sales Share in 2017
Table North America Top 5 Players Haptics Technology Revenue in 2016 and 2017
Table North America Top 5 Players Haptics Technology Revenue Market Share (%) in 2016 and 2017
Figure North America Top 5 Players Haptics Technology Revenue Share in 2016
Figure North America Top 5 Players Haptics Technology Revenue Share in 2017
Table North America Haptics Technology Sales by Type (2013-2018)
Figure 2017 North America Haptics Technology Sales Market Share by Type
Table North America Haptics Technology Sales Market Share by Type (2013-2018)
Figure North America Haptics Technology Sales Market Share by Type (2013-2018)
Table North America Haptics Technology Revenue by Type (2013-2018)
Figure North America Haptics Technology Revenue Market Share by Type in 2017
Table North America Haptics Technology Revenue Market Share by Type (2013-2018)
Figure North America Haptics Technology Revenue Market Share by Type (2013-2018)
Table North America Haptics Technology Price by Type (2013-2018)
Table North America Haptics Technology Sales by Application (2013-2018)
Figure North America Haptics Technology Sales by Application in 2017
Table North America Haptics Technology Sales Market Share by Application (2013-2018)
Figure North America Haptics Technology Sales Market Share by Application (2013-2018)
Table North America Haptics Technology Sales by Country (2013-2018)
Figure 2017 North America Haptics Technology Sales Market Share by Country
Table North America Haptics Technology Sales Market Share by Country (2013-2018)
Figure North America Haptics Technology Sales Market Share by Country (2013-2018)
Table North America Haptics Technology Import & Export (2013-2018)
Table Europe Top 5 Players Haptics Technology Sales in 2016 and 2017
Table Europe Top 5 Players Haptics Technology Sales Market Share (%) in 2016 and 2017
Figure Europe Top 5 Players Haptics Technology Sales Share in 2016
Figure Europe Top 5 Players Haptics Technology Sales Share in 2017
Table Europe Top 5 Players Haptics Technology Revenue in 2016 and 2017
Table Europe Top 5 Players Haptics Technology Revenue Market Share (%) in 2016 and 2017
Figure Europe Top 5 Players Haptics Technology Revenue Share in 2016
Figure Europe Top 5 Players Haptics Technology Revenue Share in 2017
Table Europe Haptics Technology Sales by Type (2013-2018)
Figure 2017 Europe Haptics Technology Sales Market Share by Type
Table Europe Haptics Technology Sales Market Share by Type (2013-2018)
Figure Europe Haptics Technology Sales Market Share by Type (2013-2018)
Table Europe Haptics Technology Revenue by Type (2013-2018)
Figure Europe Haptics Technology Revenue Market Share by Type in 2017
Table Europe Haptics Technology Revenue Market Share by Type (2013-2018)
Figure Europe Haptics Technology Revenue Market Share by Type (2013-2018)
Table Europe Haptics Technology Price by Type (2013-2018)
Table Europe Haptics Technology Sales by Application (2013-2018)
Figure Europe Haptics Technology Sales Market Share by Application in 2017
Table Europe Haptics Technology Sales Market Share by Application (2013-2018)
Figure Europe Haptics Technology Sales Market Share by Application (2013-2018)
Table Europe Haptics Technology Sales by Country (2013-2018)
Figure Europe Haptics Technology Sales Market Share by Country in 2017
Table Europe Haptics Technology Sales Market Share by Country (2013-2018)
Figure Europe Haptics Technology Sales Market Share by Country (2013-2018)
Table Europe Haptics Technology Import & Export (2013-2018)
Table Asia-Pacific Top 5 Players Haptics Technology Sales in 2016 and 2017
Table Asia-Pacific Top 5 Players Haptics Technology Sales Market Share (%) in 2016 and 2017
Figure Asia-Pacific Top 5 Players Haptics Technology Sales Share in 2016
Figure Asia-Pacific Top 5 Players Haptics Technology Sales Share in 2017
Table Asia-Pacific Top 5 Players Haptics Technology Revenue in 2016 and 2017
Table Asia-Pacific Top 5 Players Haptics Technology Revenue Market Share (%) in 2016 and 2017
Figure Asia-Pacific Top 5 Players Haptics Technology Revenue Share in 2016
Figure Asia-Pacific Top 5 Players Haptics Technology Revenue Share in 2017
Table Asia-Pacific Haptics Technology Sales by Type (2013-2018)
Figure Asia-Pacific Haptics Technology Sales Market Share by Type in 2017
Table Asia-Pacific Haptics Technology Sales Market Share by Type (2013-2018)
Figure Asia-Pacific Haptics Technology Sales Market Share by Type (2013-2018)
Table Asia-Pacific Haptics Technology Revenue by Type (2013-2018)
Table Asia-Pacific Haptics Technology Revenue Market Share by Type (2013-2018)
Figure Asia-Pacific Haptics Technology Revenue Market Share by Type (2013-2018)
Figure Asia-Pacific Haptics Technology Revenue Market Share by Type in 2017
Table Asia-Pacific Haptics Technology Price by Type (2013-2018)
Table Asia-Pacific Haptics Technology Sales by Application (2013-2018)
Figure Asia-Pacific Haptics Technology Sales by Application in 2017
Table Asia-Pacific Haptics Technology Sales Market Share by Application (2013-2018)
Figure Asia-Pacific Haptics Technology Sales Market Share by Application (2013-2018)
Table Asia-Pacific Haptics Technology Sales by Country (2013-2018)
Figure Asia-Pacific Haptics Technology Sales Market Share by Country in 2017
Table Asia-Pacific Haptics Technology Sales Market Share by Country (2013-2018)
Figure Asia-Pacific Haptics Technology Sales Market Share by Country (2013-2018)
Table Asia-Pacific Haptics Technology Import & Export (2013-2018)
Table South America Top 5 Players Haptics Technology Sales in 2016 and 2017
Table South America Top 5 Players Haptics Technology Sales Market Share (%) in 2016 and 2017
Figure South America Top 5 Players Haptics Technology Sales Share in 2016
Figure South America Top 5 Players Haptics Technology Sales Share in 2017
Table South America Top 5 Players Haptics Technology Revenue in 2016 and 2017
Table South America Top 5 Players Haptics Technology Revenue Market Share (%) in 2016 and 2017
Figure South America Top 5 Players Haptics Technology Revenue Share in 2016
Figure South America Top 5 Players Haptics Technology Revenue Share in 2017
Table South America Haptics Technology Sales by Type (2013-2018)
Figure South America Haptics Technology Sales by Type in 2017
Table South America Haptics Technology Sales Market Share by Type (2013-2018)
Figure South America Haptics Technology Sales Market Share by Type (2013-2018)
Table South America Haptics Technology Revenue by Type (2013-2018)
Figure South America Haptics Technology Revenue by Type in 2017
Table South America Haptics Technology Revenue Market Share by Type (2013-2018)
Figure South America Haptics Technology Revenue Market Share by Type (2013-2018)
Table South America Haptics Technology Price by Type (2013-2018)
Table South America Haptics Technology Sales by Application (2013-2018)
Figure South America Haptics Technology Sales by Application in 2017
Table South America Haptics Technology Sales Market Share by Application (2013-2018)
Figure South America Haptics Technology Sales Market Share by Application (2013-2018)
Table South America Haptics Technology Sales by Country (2013-2018)
Figure South America Haptics Technology Sales by Country in 2017
Table South America Haptics Technology Sales Market Share by Country (2013-2018)
Figure South America Haptics Technology Sales Market Share by Country (2013-2018)
Table South America Haptics Technology Import & Export (2013-2018)
Table Middle East & Africa Top 5 Players Haptics Technology Sales in 2016 and 2017
Table Middle East & Africa Top 5 Players Haptics Technology Sales Market Share (%) in 2016 and 2017
Figure Middle East & Africa Top 5 Players Haptics Technology Sales Share in 2016
Figure Middle East & Africa Top 5 Players Haptics Technology Sales Share in 2017
Table Middle East & Africa Top 5 Players Haptics Technology Revenue in 2016 and 2017
Table Middle East & Africa Top 5 Players Haptics Technology Revenue Market Share (%) in 2016 and 2017
Figure Middle East & Africa Top 5 Players Haptics Technology Revenue Share in 2016
Figure Middle East & Africa Top 5 Players Haptics Technology Revenue Share in 2017
Table Middle East & Africa Haptics Technology Sales by Type (2013-2018)
Figure Middle East & Africa Haptics Technology Sales by Type in 2017
Table Middle East & Africa Haptics Technology Sales Market Share by Type (2013-2018)
Figure Middle East & Africa Haptics Technology Sales Market Share by Type (2013-2018)
Table Middle East & Africa Haptics Technology Revenue by Type (2013-2018)
Figure Middle East & Africa Haptics Technology Revenue by Type in 2017
Table Middle East & Africa Haptics Technology Revenue Market Share by Type (2013-2018)
Figure Middle East & Africa Haptics Technology Revenue Market Share by Type (2013-2018)
Table Middle East & Africa Haptics Technology Price by Type (2013-2018)
Table Middle East & Africa Haptics Technology Sales by Application (2013-2018)
Figure Middle East & Africa Haptics Technology Sales by Application in 2017
Table Middle East & Africa Haptics Technology Sales Market Share by Application (2013-2018)
Figure Middle East & Africa Haptics Technology Sales Market Share by Application (2013-2018)
Table Middle East & Africa Haptics Technology Sales by Country (2013-2018)
Figure Middle East & Africa Haptics Technology Sales by Country in 2017
Table Middle East & Africa Haptics Technology Sales Market Share by Country (2013-2018)
Figure Middle East & Africa Haptics Technology Sales Market Share by Country (2013-2018)
Table Middle East & Africa Haptics Technology Import & Export (2013-2018)
Table AAC Technologies Basic Information, Manufacturing Base, Sales Area and Its Competitors
Table Alps Electric Haptics Technology Sales, Revenue, Price and Gross Margin (2013-2018)
Figure AAC Technologies Haptics Technology Market Share (2013-2018)
Table Alps Electric Basic Information, Manufacturing Base, Sales Area and Its Competitors
Table Alps Electric Haptics Technology Sales, Revenue, Price and Gross Margin (2013-2018)
Figure Alps Electric Haptics Technology Market Share (2013-2018)
Table Nidec Corporation Basic Information, Manufacturing Base, Sales Area and Its Competitors
Table Nidec Corporation Haptics Technology Sales, Revenue, Price and Gross Margin (2013-2018)
Figure Nidec Corporation Haptics Technology Market Share (2013-2018)
Table Cypress Semiconductor Basic Information, Manufacturing Base, Sales Area and Its Competitors
Table Cypress Semiconductor Haptics Technology Sales, Revenue, Price and Gross Margin (2013-2018)
Figure Cypress Semiconductor Haptics Technology Market Share (2013-2018)
Table Texas Instruments Basic Information, Manufacturing Base, Sales Area and Its Competitors
Table Texas Instruments Haptics Technology Sales, Revenue, Price and Gross Margin (2013-2018)
Figure Texas Instruments Haptics Technology Market Share (2013-2018)
Table Bluecom Basic Information, Manufacturing Base, Sales Area and Its Competitors
Table Bluecom Haptics Technology Sales, Revenue, Price and Gross Margin (2013-2018)
Figure Bluecom Haptics Technology Market Share (2013-2018)
Table On Semiconductor Basic Information, Manufacturing Base, Sales Area and Its Competitors
Table On Semiconductor Haptics Technology Sales, Revenue, Price and Gross Margin (2013-2018)
Figure On Semiconductor Haptics Technology Market Share (2013-2018)
Table Microchip Basic Information, Manufacturing Base, Sales Area and Its Competitors
Table Microchip Haptics Technology Sales, Revenue, Price and Gross Margin (2013-2018)
Figure Microchip Haptics Technology Market Share (2013-2018)
Table Johnson Electric Basic Information, Manufacturing Base, Sales Area and Its Competitors
Table Johnson Electric Haptics Technology Sales, Revenue, Price and Gross Margin (2013-2018)
Figure Johnson Electric Haptics Technology Market Share (2013-2018)
Table Immersion Basic Information, Manufacturing Base, Sales Area and Its Competitors
Table Immersion Haptics Technology Sales, Revenue, Price and Gross Margin (2013-2018)
Figure Immersion Haptics Technology Market Share (2013-2018)
Table Jinlong Machinery & Electronics Basic Information, Manufacturing Base, Sales Area and Its Competitors
Table Precision Microdrives Basic Information, Manufacturing Base, Sales Area and Its Competitors
Table Novasentis Basic Information, Manufacturing Base, Sales Area and Its Competitors
Figure Global Haptics Technology Sales and Growth Rate Forecast (2018-2023)
Figure Global Haptics Technology Revenue and Growth Rate Forecast (2018-2023)
Table Global Haptics Technology Sales Forecast by Regions (2018-2023)
Table Global Haptics Technology Sales Market Share Forecast by Regions (2018-2023)
Table Global Haptics Technology Sales Forecast by Type (2018-2023)
Table Global Haptics Technology Sales Market Share Forecast by Type (2018-2023)
Table Global Haptics Technology Sales Forecast by Application (2018-2023)
Table Global Haptics Technology Sales Market Share Forecast by Application (2018-2023)
Table Sales Base and Market Concentration Rate of Raw Material
Figure Price Trend of Key Raw Materials
Table Key Suppliers of Raw Materials
Figure Manufacturing Cost Structure of Haptics Technology
Figure Manufacturing Process Analysis of Haptics Technology
Figure Haptics Technology Industrial Chain Analysis
Table Raw Materials Sources of Haptics Technology Major Players in 2017
Table Major Buyers of Haptics Technology
Table Distributors/Traders List
*If Applicable.