

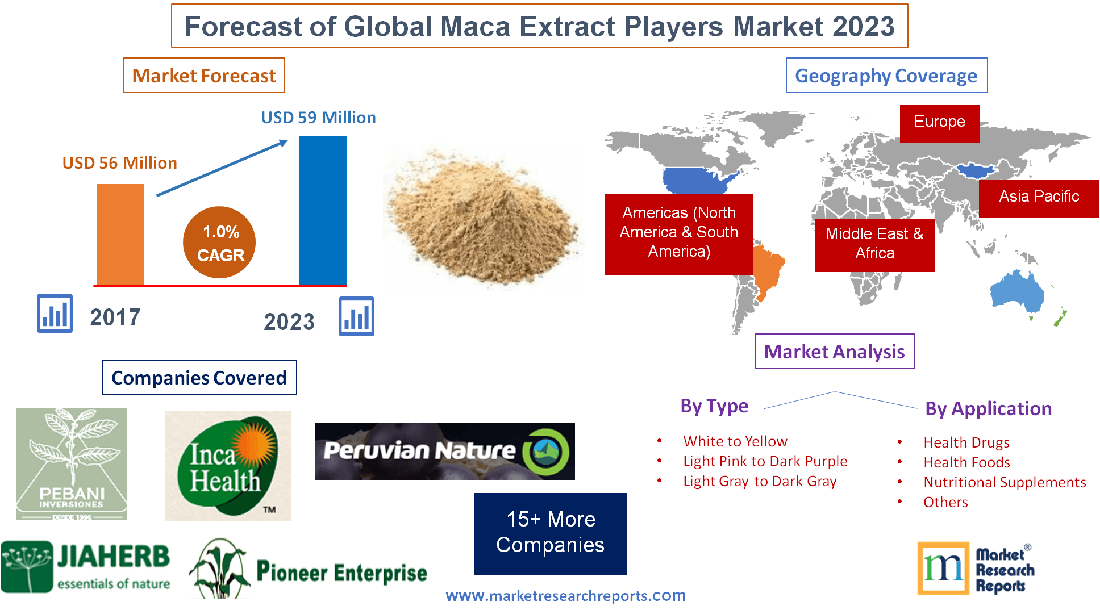
1 Maca Extract Market Overview
1.1 Product Overview and Scope of Maca Extract
1.2 Maca Extract Segment by Types
1.2.1 Global Sales Market Share of Maca Extract by Types in 2017
1.2.2 White to Yellow
1.2.2.1 Major Players of Type I
1.2.3 Light Pink to Dark Purple
1.2.3.1 Major Players of Light Pink to Dark Purple
1.2.4 Light Gray to Dark Gray
1.2.4.1 Major Players of Light Gray to Dark Gray
1.3 Maca Extract Segment by Applications
1.3.1 Maca Extract Sales Market Share by Applications in 2017
1.3.2 Health Drugs
1.3.3 Health Foods
1.3.4 Nutritional Supplements
1.3.5 Others
1.4 Maca Extract Market by Regions
1.4.1 North America Status and Prospect (2013-2023)
1.4.1.1 North America Maca Extract Revenue (Million USD) and Growth Rate (2013-2023)
1.4.2 Asia-Pacific Status and Prospect (2013-2023)
1.4.2.1 Asia-Pacific Maca Extract Revenue (Million USD) and Growth Rate (2013-2023)
1.4.3 Europe Status and Prospect (2013-2023)
1.4.3.1 Europe Maca Extract Revenue (Million USD) and Growth Rate (2013-2023)
1.4.4 South America Status and Prospect (2013-2023)
1.4.4.1 South America Maca Extract Revenue (Million USD) and Growth Rate (2013-2023)
1.4.5 Middle East and Africa Status and Prospect (2013-2023)
1.4.5.1 Middle East and Africa Maca Extract Revenue (Million USD) and Growth Rate (2013-2023)
1.5 Global Market Size (Value) of Maca Extract (2013-2023)
2 Global Maca Extract Sales, Revenue (Value) and Market Share by Players
2.1 Global Maca Extract Sales and Market Share by Players in 2016 and 2017
2.1.1 Global Maca Extract Sales by Players in 2016 and 2017
2.1.2 Global Maca Extract Sales Market Share (%) by Players in 2016 and 2017
2.2 Global Maca Extract Revenue and Market Share by Players in 2016 and 2017
2.2.1 Global Maca Extract Revenue by Players in 2016 and 2017
2.2.2 Global Maca Extract Revenue Market Share (%) by Players in 2016 and 2017
2.3 Global Maca Extract Average Price by Players in 2016 and 2017
2.4 Global Maca Extract Manufacturing Base Distribution, Sales Area, Product Types by Players
2.4.1 Global Maca Extract Manufacturing Base Distribution and Sales Area by Players
2.4.2 Players Maca Extract Product Types
2.5 Maca Extract Market Competitive Situation and Trends
2.5.1 Maca Extract Market Concentration Rate
2.5.2 Maca Extract Market Share of Top 3 and Top 5 Players
2.5.3 Mergers & Acquisitions, Expansion
3 Global Maca Extract Sales, Revenue (Value) by Regions, Type and Application (2013-2018)
3.1 Global Maca Extract Sales, Revenue and Market Share by Regions (2013-2018)
3.1.1 Global Maca Extract Sales and Market Share by Regions (2013-2018)
3.1.2 Global Maca Extract Revenue and Market Share by Regions (2013-2018)
3.2 Global Maca Extract Sales, Revenue, Market Share and Price by Type (2013-2018)
3.2.1 Global Maca Extract Sales and Market Share by Type (2013-2018)
3.2.2 Global Maca Extract Revenue and Market Share by Type (2013-2018)
3.2.3 Global Maca Extract Price by Type (2013-2018)
3.3 Global Maca Extract Sales and Market Share by Application (2013-2018)
3.3.1 Global Maca Extract Sales by Application (2013-2018)
3.3.2 Global Maca Extract Sales Market Share by Application (2013-2018)
3.4 Global Maca Extract Sales, Revenue, Price and Gross Margin (2013-2018)
4 North America Top 5 Players Maca Extract Sales, Revenue and Price
4.1 North America Top 5 Players Maca Extract Sales, Revenue and Market Share in 2016 and 2017
4.1.1 North America Top 5 Players Maca Extract Sales and Market Share in 2016 and 2017
4.1.2 North America Top 5 Players Maca Extract Revenue and Market Share in 2016 and 2017
4.2 North America Maca Extract Sales, Revenue, Market Share and Price by Type (2013-2018)
4.2.1 North America Maca Extract Sales and Market Share by Type (2013-2018)
4.2.1.1 North America Maca Extract Sales by Type (2013-2018)
4.2.1.2 North America Maca Extract Sales Market Share by Type (2013-2018)
4.2.2 North America Maca Extract Revenue and Market Share by Type (2013-2018)
4.2.2.1 North America Maca Extract Revenue by Type (2013-2018)
4.2.2.2 North America Maca Extract Revenue Market Share by Type (2013-2018)
4.2.3 North America Maca Extract Price by Type (2013-2018)
4.3 North America Maca Extract Sales and Market Share by Application (2013-2018)
4.3.1 North America Maca Extract Sales by Application (2013-2018)
4.3.2 North America Maca Extract Sales Market Share by Application (2013-2018)
4.4 North America Maca Extract Sales and Market Share by Country (US, Canada and Mexico) (2013-2018)
4.4.1 North America Maca Extract Sales by Country (2013-2018)
4.4.2 North America Maca Extract Sales Market Share by Country (2013-2018)
4.5 North America Maca Extract Import & Export (2013-2018)
5 Europe Top 5 Players Maca Extract Sales, Revenue and Price
5.1 Europe Top 5 Players Maca Extract Sales, Revenue and Market Share in 2016 and 2017
5.1.1 Europe Top 5 Players Maca Extract Sales and Market Share in 2016 and 2017
5.1.2 Europe Top 5 Players Maca Extract Revenue and Market Share in 2016 and 2017
5.2 Europe Maca Extract Sales, Revenue, Market Share and Price by Type (2013-2018)
5.2.1 Europe Maca Extract Sales and Market Share by Type (2013-2018)
5.2.1.1 Europe Maca Extract Sales by Type (2013-2018)
5.2.1.2 Europe Maca Extract Sales Market Share by Type (2013-2018)
5.2.2 Europe Maca Extract Revenue and Market Share by Type (2013-2018)
5.2.2.1 Europe Maca Extract Revenue by Type (2013-2018)
5.2.2.2 Europe Maca Extract Revenue Market Share by Type (2013-2018)
5.2.3 Europe Maca Extract Price by Type (2013-2018)
5.3 Europe Maca Extract Sales and Market Share by Application (2013-2018)
5.3.1 Europe Maca Extract Sales by Application (2013-2018)
5.3.2 Europe Maca Extract Sales Market Share by Application (2013-2018)
5.4 Europe Maca Extract Sales and Market Share by Country (Germany, UK, France, Italy and Russia) (2013-2018)
5.4.1 Europe Maca Extract Sales by Country (2013-2018)
5.4.2 Europe Maca Extract Sales Market Share by Country (2013-2018)
5.5 Europe Maca Extract Import & Export (2013-2018)
6 Asia-Pacific Top 5 Players Maca Extract Sales, Revenue and Price
6.1 Asia-Pacific Top 5 Players Maca Extract Sales, Revenue and Market Share in 2016 and 2017
6.1.1 Asia-Pacific Top 5 Players Maca Extract Sales and Market Share in 2016 and 2017
6.1.2 Asia-Pacific Top 5 Players Maca Extract Revenue and Market Share in 2016 and 2017
6.2 Asia-Pacific Maca Extract Sales, Revenue, Market Share and Price by Type (2013-2018)
6.2.1 Asia-Pacific Maca Extract Sales and Market Share by Type (2013-2018)
6.2.1.1 Asia-Pacific Maca Extract Sales by Type (2013-2018)
6.2.1.2 Asia-Pacific Maca Extract Sales Market Share by Type (2013-2018)
6.2.2 Asia-Pacific Maca Extract Revenue and Market Share by Type (2013-2018)
6.2.3 Asia-Pacific Maca Extract Price by Type (2013-2018)
6.3 Asia-Pacific Maca Extract Sales and Market Share by Application (2013-2018)
6.3.1 Asia-Pacific Maca Extract Sales by Application (2013-2018)
6.3.2 Asia-Pacific Maca Extract Sales Market Share by Application (2013-2018)
6.4 Asia-Pacific Maca Extract Sales and Market Share by Country (China, Japan, Southeast Asia, India, Korea and Australia) (2013-2018)
6.4.1 Asia-Pacific Maca Extract Sales by Country (2013-2018)
6.4.2 Asia-Pacific Maca Extract Sales Market Share by Country (2013-2018)
6.5 Asia-Pacific Maca Extract Import & Export (2013-2018)
7 South America Top 5 Players Maca Extract Sales, Revenue and Price
7.1 South America Top 5 Players Maca Extract Sales, Revenue and Market Share in 2016 and 2017
7.1.1 South America Top 5 Players Maca Extract Sales and Market Share in 2016 and 2017
7.1.2 South America Top 5 Players Maca Extract Revenue and Market Share in 2016 and 2017
7.2 South America Maca Extract Sales, Revenue, Market Share and Price by Type (2013-2018)
7.2.1 South America Maca Extract Sales and Market Share by Type (2013-2018)
7.2.1.1 South America Maca Extract Sales by Type (2013-2018)
7.2.1.2 South America Maca Extract Sales Market Share by Type (2013-2018)
7.2.2 South America Maca Extract Revenue and Market Share by Type (2013-2018)
7.2.2.1 South America Maca Extract Revenue by Type (2013-2018)
7.2.2.2 South America Maca Extract Revenue and Market Share by Type (2013-2018)
7.2.3 South America Maca Extract Price by Type (2013-2018)
7.3 South America Maca Extract Sales and Market Share by Application (2013-2018)
7.3.1 South America Maca Extract Sales by Application (2013-2018)
7.3.2 South America Maca Extract Sales Market Share by Application (2013-2018)
7.4 South America Maca Extract Sales and Market Share by Country (Brazil, Argentina, Chile and Peru) (2013-2018)
7.4.1 South America Maca Extract Sales by Country (2013-2018)
7.4.2 South America Maca Extract Sales Market Share by Country (2013-2018)
7.5 South America Maca Extract Import & Export (2013-2018)
8 Middle East & Africa Top 5 Players Maca Extract Sales, Revenue and Price
8.1 Middle East & Africa Top 5 Players Maca Extract Sales, Revenue and Market Share in 2016 and 2017
8.1.1 Middle East & Africa Top 5 Players Maca Extract Sales and Market Share in 2016 and 2017
8.1.2 Middle East & Africa Top 5 Players Maca Extract Revenue and Market Share in 2016 and 2017
8.2 Middle East & Africa Maca Extract Sales, Revenue, Market Share and Price by Type (2013-2018)
8.2.1 Middle East & Africa Maca Extract Sales and Market Share by Type (2013-2018)
8.2.1.1 Middle East & Africa Maca Extract Sales by Type (2013-2018)
8.2.1.2 Middle East & Africa Maca Extract Sales Market Share by Type (2013-2018)
8.2.2 Middle East & Africa Maca Extract Revenue and Market Share by Type (2013-2018)
8.2.2.1 Middle East & Africa Maca Extract Revenue by Type (2013-2018)
8.2.2.2 Middle East & Africa Maca Extract Revenue Market Share by Type (2013-2018)
8.2.3 Middle East & Africa Maca Extract Price by Type (2013-2018)
8.3 Middle East & Africa Maca Extract Sales and Market Share by Application (2013-2018)
8.3.1 Middle East & Africa Maca Extract Sales by Application (2013-2018)
8.3.2 Middle East & Africa Maca Extract Sales Market Share by Application (2013-2018)
8.4 Middle East & Africa Maca Extract Sales and Market Share by Country (Egypt, Saudi Arabia, South Africa and Iran) (2013-2018)
8.4.1 Middle East & Africa Maca Extract Sales by Country (2013-2018)
8.4.2 Middle East & Africa Maca Extract Sales Market Share by Country (2013-2018)
8.5 Middle East & Africa Maca Extract Import & Export (2013-2018)
9 Global Maca Extract Players Profiles/Analysis
9.1 Koken
9.1.1 Company Basic Information, Manufacturing Base, Sales Area and Its Competitors
9.1.2 Maca Extract Product Types, Application and Specification
9.1.2.1 Product A
9.1.2.2 Product B
9.1.3 Koken Maca Extract Sales, Revenue, Price and Gross Margin (2013-2018)
9.1.4 Main Business/Business Overview
9.1.5 Koken News
9.2 Peruvian Nature
9.2.1 Company Basic Information, Manufacturing Base, Sales Area and Its Competitors
9.2.2 Maca Extract Product Types, Application and Specification
9.2.2.1 Product A
9.2.2.2 Product B
9.2.3 Peruvian Nature Maca Extract Sales, Revenue, Price and Gross Margin (2013-2018)
9.2.4 Main Business/Business Overview
9.2.5 Peruvian Nature News
9.3 Panpacific Corporation
9.3.1 Company Basic Information, Manufacturing Base, Sales Area and Its Competitors
9.3.2 Maca Extract Product Types, Application and Specification
9.3.2.1 Product A
9.3.2.2 Product B
9.3.3 Panpacific Corporation Maca Extract Sales, Revenue, Price and Gross Margin (2013-2018)
9.3.4 Main Business/Business Overview
9.3.5 Panpacific Corporation News
9.4 Natural Health International
9.4.1 Company Basic Information, Manufacturing Base, Sales Area and Its Competitors
9.4.2 Maca Extract Product Types, Application and Specification
9.4.2.1 Product A
9.4.2.2 Product B
9.4.3 Natural Health International Maca Extract Sales, Revenue, Price and Gross Margin (2013-2018)
9.4.4 Main Business/Business Overview
9.4.5 Natural Health International News
9.5 Inca Health
9.5.1 Company Basic Information, Manufacturing Base, Sales Area and Its Competitors
9.5.2 Maca Extract Product Types, Application and Specification
9.5.2.1 Product A
9.5.2.2 Product B
9.5.3 Inca Health Maca Extract Sales, Revenue, Price and Gross Margin (2013-2018)
9.5.4 Main Business/Business Overview
9.5.5 Inca Health News
9.6 ZANACEUTICA
9.6.1 Company Basic Information, Manufacturing Base, Sales Area and Its Competitors
9.6.2 Maca Extract Product Types, Application and Specification
9.6.2.1 Product A
9.6.2.2 Product B
9.6.3 ZANACEUTICA Maca Extract Sales, Revenue, Price and Gross Margin (2013-2018)
9.6.4 Main Business/Business Overview
9.6.5 ZANACEUTICA News
9.7 MG Natura Peru
9.7.1 Company Basic Information, Manufacturing Base, Sales Area and Its Competitors
9.7.2 Maca Extract Product Types, Application and Specification
9.7.2.1 Product A
9.7.2.2 Product B
9.7.3 MG Natura Peru Maca Extract Sales, Revenue, Price and Gross Margin (2013-2018)
9.7.4 Main Business/Business Overview
9.7.5 MG Natura Peru News
9.8 Pebani Inversiones
9.8.1 Company Basic Information, Manufacturing Base, Sales Area and Its Competitors
9.8.2 Maca Extract Product Types, Application and Specification
9.8.2.1 Product A
9.8.2.2 Product B
9.8.3 Pebani Inversiones Maca Extract Sales, Revenue, Price and Gross Margin (2013-2018)
9.8.4 Main Business/Business Overview
9.8.5 Pebani Inversiones News
9.9 StandPeru
9.9.1 Company Basic Information, Manufacturing Base, Sales Area and Its Competitors
9.9.2 Maca Extract Product Types, Application and Specification
9.9.2.1 Product A
9.9.2.2 Product B
9.9.3 StandPeru Maca Extract Sales, Revenue, Price and Gross Margin (2013-2018)
9.9.4 Main Business/Business Overview
9.9.5 StandPeru News
9.10 Phyto Life Sciences
9.10.1 Company Basic Information, Manufacturing Base, Sales Area and Its Competitors
9.10.2 Maca Extract Product Types, Application and Specification
9.10.2.1 Product A
9.10.2.2 Product B
9.10.3 Phyto Life Sciences Maca Extract Sales, Revenue, Price and Gross Margin (2013-2018)
9.10.4 Main Business/Business Overview
9.10.5 Phyto Life Sciences News
9.11 Jiaherb
9.12 Pioneer Herbs
9.13 Green Life
9.14 Yuansn Biological
9.15 Bettering
9.16 Yongyuan Bio-Tech
9.17 Naturalin
9.18 Berbchem Biotech
9.19 Tengmai
9.20 Huike
10 Global Maca Extract Market Forecast (2018-2023)
10.1 Global Maca Extract Sales, Revenue Forecast (2018-2023)
10.2 Global Maca Extract Sales, Consumption Forecast by Regions (2018-2023)
10.2.1 Global Maca Extract Sales Forecast by Regions (2018-2023)
10.2.2 Global Maca Extract Sales Market Share Forecast by Regions (2018-2023)
10.3 Global Maca Extract Sales and Market Share Forecast by Type (2018-2023)
10.3.1 Global Maca Extract Sales Forecast by Type (2018-2023)
10.3.2 Global Maca Extract Sales Market Share Forecast by Type (2018-2023)
10.4 Global Maca Extract Sales and Market Share Forecast by Application (2018-2023)
10.4.1 Global Maca Extract Sales Forecast by Application (2018-2023)
10.4.2 Global Maca Extract Sales Market Share Forecast by Application (2018-2023)
10.5 Maca Extract Price Forecast (2018-2023)
11 Maca Extract Manufacturing Cost Analysis
11.1 Maca Extract Key Raw Materials Analysis
11.1.1 Key Raw Materials
11.1.2 Price Trend of Key Raw Materials
11.1.3 Key Suppliers of Raw Materials
11.1.4 Market Concentration Rate of Raw Materials
11.2 Proportion of Manufacturing Cost Structure
11.2.1 Raw Materials
11.2.2 Labor Cost
11.2.3 Manufacturing Expenses
11.3 Manufacturing Process Analysis of Maca Extract
12 Industrial Chain, Sourcing Strategy and Downstream Buyers
12.1 Maca Extract Industrial Chain Analysis
12.2 Upstream Raw Materials Sourcing
12.3 Raw Materials Sources of Maca Extract Major Players in 2017
12.4 Downstream Buyers
13 Marketing Strategy Analysis, Distributors/Traders
13.1 Marketing Channel
13.1.1 Direct Marketing
13.1.2 Indirect Marketing
13.1.3 Marketing Channel Development Trend
13.2 Market Positioning
13.2.1 Pricing Strategy
13.2.2 Brand Strategy
13.2.3 Target Client
13.3 Distributors/Traders List
14 Market Effect Factors Analysis
14.1 Technology Progress/Risk
14.1.1 Substitutes Threat
14.1.2 Technology Progress in Related Industry
14.2 Consumer Needs/Customer Preference Change
14.3 Economic/Political Environmental Change
15 Research Findings and Conclusion
16 Appendix
16.1 Methodology
16.2 Data Source
List of Tables and Figures
Figure Picture of Maca Extract
Table Product Specifications of Maca Extract
Figure Global Sales Market Share of Maca Extract by Types in 2017
Figure Product Picture of White to Yellow
Table Major Players of White to Yellow
Figure Product Picture of Light Pink to Dark Purple
Table Major Players of Light Pink to Dark Purple
Figure Product Picture of Light Gray to Dark Gray
Table Major Players of Light Gray to Dark Gray
Figure Maca Extract Sales Market Share by Applications in 2017
Table Applications of Maca Extract
Figure Health Foods Examples
Figure Nutritional Supplements Examples
Figure Others Examples
Figure North America Maca Extract Revenue (Million USD) and Growth Rate (2013-2023)
Figure Asia-Pacific Maca Extract Revenue (Million USD) and Growth Rate (2013-2023)
Figure Europe Maca Extract Revenue (Million USD) and Growth Rate (2013-2023)
Figure South America Maca Extract Revenue (Million USD) and Growth Rate (2013-2023)
Figure Middle East and Africa Maca Extract Revenue (Million USD) and Growth Rate (2013-2023)
Figure Global Maca Extract Revenue (Million USD) and Growth Rate (2013-2023)
Table Global Maca Extract Sales by Players in 2016 and 2017
Table Global Maca Extract Sales Market Share (%) by Players in 2016 and 2017
Figure Global Maca Extract Sales Market Share by Players in 2016
Figure Global Maca Extract Sales Market Share by Players in 2017
Table Global Maca Extract Revenue by Players in 2016 and 2017
Table Global Maca Extract Revenue Market Share (%) by Players in 2016 and 2017
Figure Global Maca Extract Revenue Market Share by Players in 2016
Figure Global Maca Extract Revenue Market Share by Players in 2017
Table Global Maca Extract Average Price by Players in 2016 and 2017
Figure Global Maca Extract Average Price by Players in 2017
Table Global Maca Extract Manufacturing Base Distribution and Sales Area by Players
Table Players Maca Extract Product Types
Figure Maca Extract Market Share of Top 3 Players
Figure Maca Extract Market Share of Top 5 Players
Table Global Maca Extract Sales by Regions (2013-2018)
Table Global Maca Extract Sales Market Share by Regions (2013-2018)
Figure Global Maca Extract Sales Market Share by Regions (2013-2018)
Figure Global Maca Extract Sales Market Share by Regions in 2017
Table Global Maca Extract Revenue by Regions (2013-2018)
Table Global Maca Extract Revenue Market Share by Regions (2013-2018)
Figure Global Maca Extract Revenue Market Share by Regions (2013-2018)
Figure Global Maca Extract Revenue Market Share by Regions in 2017
Table Global Maca Extract Sales by Type (2013-2018)
Table Global Maca Extract Sales Market Share by Type (2013-2018)
Figure Global Maca Extract Sales Market Share by Type (2013-2018)
Figure Global Maca Extract Sales Market Share by Type in 2017
Table Global Maca Extract Revenue by Type (2013-2018)
Table Global Maca Extract Revenue Market Share by Type (2013-2018)
Figure Global Maca Extract Revenue Market Share by Type (2013-2018)
Figure Global Maca Extract Revenue Market Share by Type in 2017
Table Global Maca Extract Price by Type (2013-2018)
Table Global Maca Extract Sales by Application (2013-2018)
Figure Global Maca Extract Sales Market Share by Application in 2017
Table Global Maca Extract Sales Market Share by Application (2013-2018)
Figure Global Maca Extract Sales Market Share by Application (2013-2018)
Table Global Maca Extract Sales, Revenue, Price and Gross Margin (2013-2018)
Table North America Top 5 Players Maca Extract Sales in 2016 and 2017
Table North America Top 5 Players Maca Extract Sales Market Share (%) in 2016 and 2017
Figure North America Top 5 Players Maca Extract Sales Share in 2016
Figure North America Top 5 Players Maca Extract Sales Share in 2017
Table North America Top 5 Players Maca Extract Revenue in 2016 and 2017
Table North America Top 5 Players Maca Extract Revenue Market Share (%) in 2016 and 2017
Figure North America Top 5 Players Maca Extract Revenue Share in 2016
Figure North America Top 5 Players Maca Extract Revenue Share in 2017
Table North America Maca Extract Sales by Type (2013-2018)
Figure 2017 North America Maca Extract Sales Market Share by Type
Table North America Maca Extract Sales Market Share by Type (2013-2018)
Figure North America Maca Extract Sales Market Share by Type (2013-2018)
Table North America Maca Extract Revenue by Type (2013-2018)
Figure North America Maca Extract Revenue Market Share by Type in 2017
Table North America Maca Extract Revenue Market Share by Type (2013-2018)
Figure North America Maca Extract Revenue Market Share by Type (2013-2018)
Table North America Maca Extract Price by Type (2013-2018)
Table North America Maca Extract Sales by Application (2013-2018)
Figure North America Maca Extract Sales by Application in 2017
Table North America Maca Extract Sales Market Share by Application (2013-2018)
Figure North America Maca Extract Sales Market Share by Application (2013-2018)
Table North America Maca Extract Sales by Country (2013-2018)
Figure 2017 North America Maca Extract Sales Market Share by Country
Table North America Maca Extract Sales Market Share by Country (2013-2018)
Figure North America Maca Extract Sales Market Share by Country (2013-2018)
Table North America Maca Extract Import & Export (2013-2018)
Table Europe Top 5 Players Maca Extract Sales in 2016 and 2017
Table Europe Top 5 Players Maca Extract Sales Market Share (%) in 2016 and 2017
Figure Europe Top 5 Players Maca Extract Sales Share in 2016
Figure Europe Top 5 Players Maca Extract Sales Share in 2017
Table Europe Top 5 Players Maca Extract Revenue in 2016 and 2017
Table Europe Top 5 Players Maca Extract Revenue Market Share (%) in 2016 and 2017
Figure Europe Top 5 Players Maca Extract Revenue Share in 2016
Figure Europe Top 5 Players Maca Extract Revenue Share in 2017
Table Europe Maca Extract Sales by Type (2013-2018)
Figure 2017 Europe Maca Extract Sales Market Share by Type
Table Europe Maca Extract Sales Market Share by Type (2013-2018)
Figure Europe Maca Extract Sales Market Share by Type (2013-2018)
Table Europe Maca Extract Revenue by Type (2013-2018)
Figure Europe Maca Extract Revenue Market Share by Type in 2017
Table Europe Maca Extract Revenue Market Share by Type (2013-2018)
Figure Europe Maca Extract Revenue Market Share by Type (2013-2018)
Table Europe Maca Extract Price by Type (2013-2018)
Table Europe Maca Extract Sales by Application (2013-2018)
Figure Europe Maca Extract Sales Market Share by Application in 2017
Table Europe Maca Extract Sales Market Share by Application (2013-2018)
Figure Europe Maca Extract Sales Market Share by Application (2013-2018)
Table Europe Maca Extract Sales by Country (2013-2018)
Figure Europe Maca Extract Sales Market Share by Country in 2017
Table Europe Maca Extract Sales Market Share by Country (2013-2018)
Figure Europe Maca Extract Sales Market Share by Country (2013-2018)
Table Europe Maca Extract Import & Export (2013-2018)
Table Asia-Pacific Top 5 Players Maca Extract Sales in 2016 and 2017
Table Asia-Pacific Top 5 Players Maca Extract Sales Market Share (%) in 2016 and 2017
Figure Asia-Pacific Top 5 Players Maca Extract Sales Share in 2016
Figure Asia-Pacific Top 5 Players Maca Extract Sales Share in 2017
Table Asia-Pacific Top 5 Players Maca Extract Revenue in 2016 and 2017
Table Asia-Pacific Top 5 Players Maca Extract Revenue Market Share (%) in 2016 and 2017
Figure Asia-Pacific Top 5 Players Maca Extract Revenue Share in 2016
Figure Asia-Pacific Top 5 Players Maca Extract Revenue Share in 2017
Table Asia-Pacific Maca Extract Sales by Type (2013-2018)
Figure Asia-Pacific Maca Extract Sales Market Share by Type in 2017
Table Asia-Pacific Maca Extract Sales Market Share by Type (2013-2018)
Figure Asia-Pacific Maca Extract Sales Market Share by Type (2013-2018)
Table Asia-Pacific Maca Extract Revenue by Type (2013-2018)
Table Asia-Pacific Maca Extract Revenue Market Share by Type (2013-2018)
Figure Asia-Pacific Maca Extract Revenue Market Share by Type (2013-2018)
Figure Asia-Pacific Maca Extract Revenue Market Share by Type in 2017
Table Asia-Pacific Maca Extract Price by Type (2013-2018)
Table Asia-Pacific Maca Extract Sales by Application (2013-2018)
Figure Asia-Pacific Maca Extract Sales by Application in 2017
Table Asia-Pacific Maca Extract Sales Market Share by Application (2013-2018)
Figure Asia-Pacific Maca Extract Sales Market Share by Application (2013-2018)
Table Asia-Pacific Maca Extract Sales by Country (2013-2018)
Figure Asia-Pacific Maca Extract Sales Market Share by Country in 2017
Table Asia-Pacific Maca Extract Sales Market Share by Country (2013-2018)
Figure Asia-Pacific Maca Extract Sales Market Share by Country (2013-2018)
Table Asia-Pacific Maca Extract Import & Export (2013-2018)
Table South America Top 5 Players Maca Extract Sales in 2016 and 2017
Table South America Top 5 Players Maca Extract Sales Market Share (%) in 2016 and 2017
Figure South America Top 5 Players Maca Extract Sales Share in 2016
Figure South America Top 5 Players Maca Extract Sales Share in 2017
Table South America Top 5 Players Maca Extract Revenue in 2016 and 2017
Table South America Top 5 Players Maca Extract Revenue Market Share (%) in 2016 and 2017
Figure South America Top 5 Players Maca Extract Revenue Share in 2016
Figure South America Top 5 Players Maca Extract Revenue Share in 2017
Table South America Maca Extract Sales by Type (2013-2018)
Figure South America Maca Extract Sales by Type in 2017
Table South America Maca Extract Sales Market Share by Type (2013-2018)
Figure South America Maca Extract Sales Market Share by Type (2013-2018)
Table South America Maca Extract Revenue by Type (2013-2018)
Figure South America Maca Extract Revenue by Type in 2017
Table South America Maca Extract Revenue Market Share by Type (2013-2018)
Figure South America Maca Extract Revenue Market Share by Type (2013-2018)
Table South America Maca Extract Price by Type (2013-2018)
Table South America Maca Extract Sales by Application (2013-2018)
Figure South America Maca Extract Sales by Application in 2017
Table South America Maca Extract Sales Market Share by Application (2013-2018)
Figure South America Maca Extract Sales Market Share by Application (2013-2018)
Table South America Maca Extract Sales by Country (2013-2018)
Figure South America Maca Extract Sales by Country in 2017
Table South America Maca Extract Sales Market Share by Country (2013-2018)
Figure South America Maca Extract Sales Market Share by Country (2013-2018)
Table South America Maca Extract Import & Export (2013-2018)
Table Middle East & Africa Top 5 Players Maca Extract Sales in 2016 and 2017
Table Middle East & Africa Top 5 Players Maca Extract Sales Market Share (%) in 2016 and 2017
Figure Middle East & Africa Top 5 Players Maca Extract Sales Share in 2016
Figure Middle East & Africa Top 5 Players Maca Extract Sales Share in 2017
Table Middle East & Africa Top 5 Players Maca Extract Revenue in 2016 and 2017
Table Middle East & Africa Top 5 Players Maca Extract Revenue Market Share (%) in 2016 and 2017
Figure Middle East & Africa Top 5 Players Maca Extract Revenue Share in 2016
Figure Middle East & Africa Top 5 Players Maca Extract Revenue Share in 2017
Table Middle East & Africa Maca Extract Sales by Type (2013-2018)
Figure Middle East & Africa Maca Extract Sales by Type in 2017
Table Middle East & Africa Maca Extract Sales Market Share by Type (2013-2018)
Figure Middle East & Africa Maca Extract Sales Market Share by Type (2013-2018)
Table Middle East & Africa Maca Extract Revenue by Type (2013-2018)
Figure Middle East & Africa Maca Extract Revenue by Type in 2017
Table Middle East & Africa Maca Extract Revenue Market Share by Type (2013-2018)
Figure Middle East & Africa Maca Extract Revenue Market Share by Type (2013-2018)
Table Middle East & Africa Maca Extract Price by Type (2013-2018)
Table Middle East & Africa Maca Extract Sales by Application (2013-2018)
Figure Middle East & Africa Maca Extract Sales by Application in 2017
Table Middle East & Africa Maca Extract Sales Market Share by Application (2013-2018)
Table Middle East & Africa Maca Extract Sales Market Share by Country (2013-2018)
Table Middle East & Africa Maca Extract Sales by Country (2013-2018)
Figure Middle East & Africa Maca Extract Sales by Country in 2017
Table Middle East & Africa Maca Extract Sales Market Share by Country (2013-2018)
Figure Middle East & Africa Maca Extract Sales Market Share by Country (2013-2018)
Table Middle East & Africa Maca Extract Import & Export (2013-2018)
Table Koken Basic Information, Manufacturing Base, Sales Area and Its Competitors
Table Koken Maca Extract Sales, Revenue, Price and Gross Margin (2013-2018)
Figure Koken Maca Extract Market Share (2013-2018)
Table Peruvian Nature Basic Information, Manufacturing Base, Sales Area and Its Competitors
Table Peruvian Nature Maca Extract Sales, Revenue, Price and Gross Margin (2013-2018)
Figure Peruvian Nature Maca Extract Market Share (2013-2018)
Table Panpacific Corporation Basic Information, Manufacturing Base, Sales Area and Its Competitors
Table Panpacific Corporation Maca Extract Sales, Revenue, Price and Gross Margin (2013-2018)
Figure Panpacific Corporation Maca Extract Market Share (2013-2018)
Table Natural Health International Basic Information, Manufacturing Base, Sales Area and Its Competitors
Table Natural Health International Maca Extract Sales, Revenue, Price and Gross Margin (2013-2018)
Figure Natural Health International Maca Extract Market Share (2013-2018)
Table Inca Health Basic Information, Manufacturing Base, Sales Area and Its Competitors
Table Inca Health Maca Extract Sales, Revenue, Price and Gross Margin (2013-2018)
Figure Inca Health Maca Extract Market Share (2013-2018)
Table ZANACEUTICA Basic Information, Manufacturing Base, Sales Area and Its Competitors
Table ZANACEUTICA Maca Extract Sales, Revenue, Price and Gross Margin (2013-2018)
Figure ZANACEUTICA Maca Extract Market Share (2013-2018)
Table MG Natura Peru Basic Information, Manufacturing Base, Sales Area and Its Competitors
Table MG Natura Peru Maca Extract Sales, Revenue, Price and Gross Margin (2013-2018)
Figure MG Natura Peru Maca Extract Market Share (2013-2018)
Table Pebani Inversiones Basic Information, Manufacturing Base, Sales Area and Its Competitors
Table Pebani Inversiones Maca Extract Sales, Revenue, Price and Gross Margin (2013-2018)
Figure Pebani Inversiones Maca Extract Market Share (2013-2018)
Table StandPeru Basic Information, Manufacturing Base, Sales Area and Its Competitors
Table StandPeru Maca Extract Sales, Revenue, Price and Gross Margin (2013-2018)
Figure StandPeru Maca Extract Market Share (2013-2018)
Table Phyto Life Sciences Basic Information, Manufacturing Base, Sales Area and Its Competitors
Table Phyto Life Sciences Maca Extract Sales, Revenue, Price and Gross Margin (2013-2018)
Figure Phyto Life Sciences Maca Extract Market Share (2013-2018)
Table Jiaherb Basic Information, Manufacturing Base, Sales Area and Its Competitors
Table Pioneer Herbs Basic Information, Manufacturing Base, Sales Area and Its Competitors
Table Green Life Basic Information, Manufacturing Base, Sales Area and Its Competitors
Table Yuansn Biological Basic Information, Manufacturing Base, Sales Area and Its Competitors
Table Bettering Basic Information, Manufacturing Base, Sales Area and Its Competitors
Table Yongyuan Bio-Tech Basic Information, Manufacturing Base, Sales Area and Its Competitors
Table Naturalin Basic Information, Manufacturing Base, Sales Area and Its Competitors
Table Berbchem Biotech Basic Information, Manufacturing Base, Sales Area and Its Competitors
Table Tengmai Basic Information, Manufacturing Base, Sales Area and Its Competitors
Table Huike Basic Information, Manufacturing Base, Sales Area and Its Competitors
Figure Global Maca Extract Sales and Growth Rate Forecast (2018-2023)
Figure Global Maca Extract Revenue and Growth Rate Forecast (2018-2023)
Table Global Maca Extract Sales Forecast by Regions (2018-2023)
Table Global Maca Extract Sales Market Share Forecast by Regions (2018-2023)
Table Global Maca Extract Sales Forecast by Type (2018-2023)
Table Global Maca Extract Sales Market Share Forecast by Type (2018-2023)
Table Global Maca Extract Sales Forecast by Application (2018-2023)
Table Global Maca Extract Sales Market Share Forecast by Application (2018-2023)
Table Sales Base and Market Concentration Rate of Raw Material
Figure Price Trend of Key Raw Materials
Table Key Suppliers of Raw Materials
Figure Manufacturing Cost Structure of Maca Extract
Figure Manufacturing Process Analysis of Maca Extract
Figure Maca Extract Industrial Chain Analysis
Table Raw Materials Sources of Maca Extract Major Players in 2017
Table Major Buyers of Maca Extract
Table Distributors/Traders List
*If Applicable.