


Demand Forecasting: Statistical Models, Expert Judgment, and AI-Assisted Methods Compared
Demand Forecasting: Statistical Models, Expert Judgment, and AI-Assisted Methods Compared
Executive Summary
Peloton Interactive's fiscal 2022 financial statements show a $224.9 million excess and obsolete inventory reserve adjustment, up from $38.7 million the prior fiscal year - alongside a $390.5 million impairment expense and a $181.9 million goodwill impairment recorded in the same period. Together these figures reflect a company that had built production and inventory plans around a demand forecast assuming pandemic-era exercise-equipment purchasing would continue at its 2020–2021 pace, and was left holding inventory the market no longer wanted to absorb at that volume once conditions normalized. The case is a useful anchor for this article because the underlying forecasting error was not a failure of mathematical sophistication - it was a failure to update a demand model fast enough once the structural conditions the original forecast depended on had changed. This article compares the three families of demand forecasting methodology and sets out where each is strongest and where each, used alone, creates exactly this kind of exposure.
What Is Demand Forecasting?
Demand forecasting is the structured estimation of future customer demand for a product or service, used to inform production planning, inventory commitments, staffing, and capital allocation decisions. Its output is always a projection under stated assumptions, not a guarantee - the discipline's central risk is treating the projection as more certain than the assumptions underneath it actually justify.
Method 1: Statistical and Time-Series Models
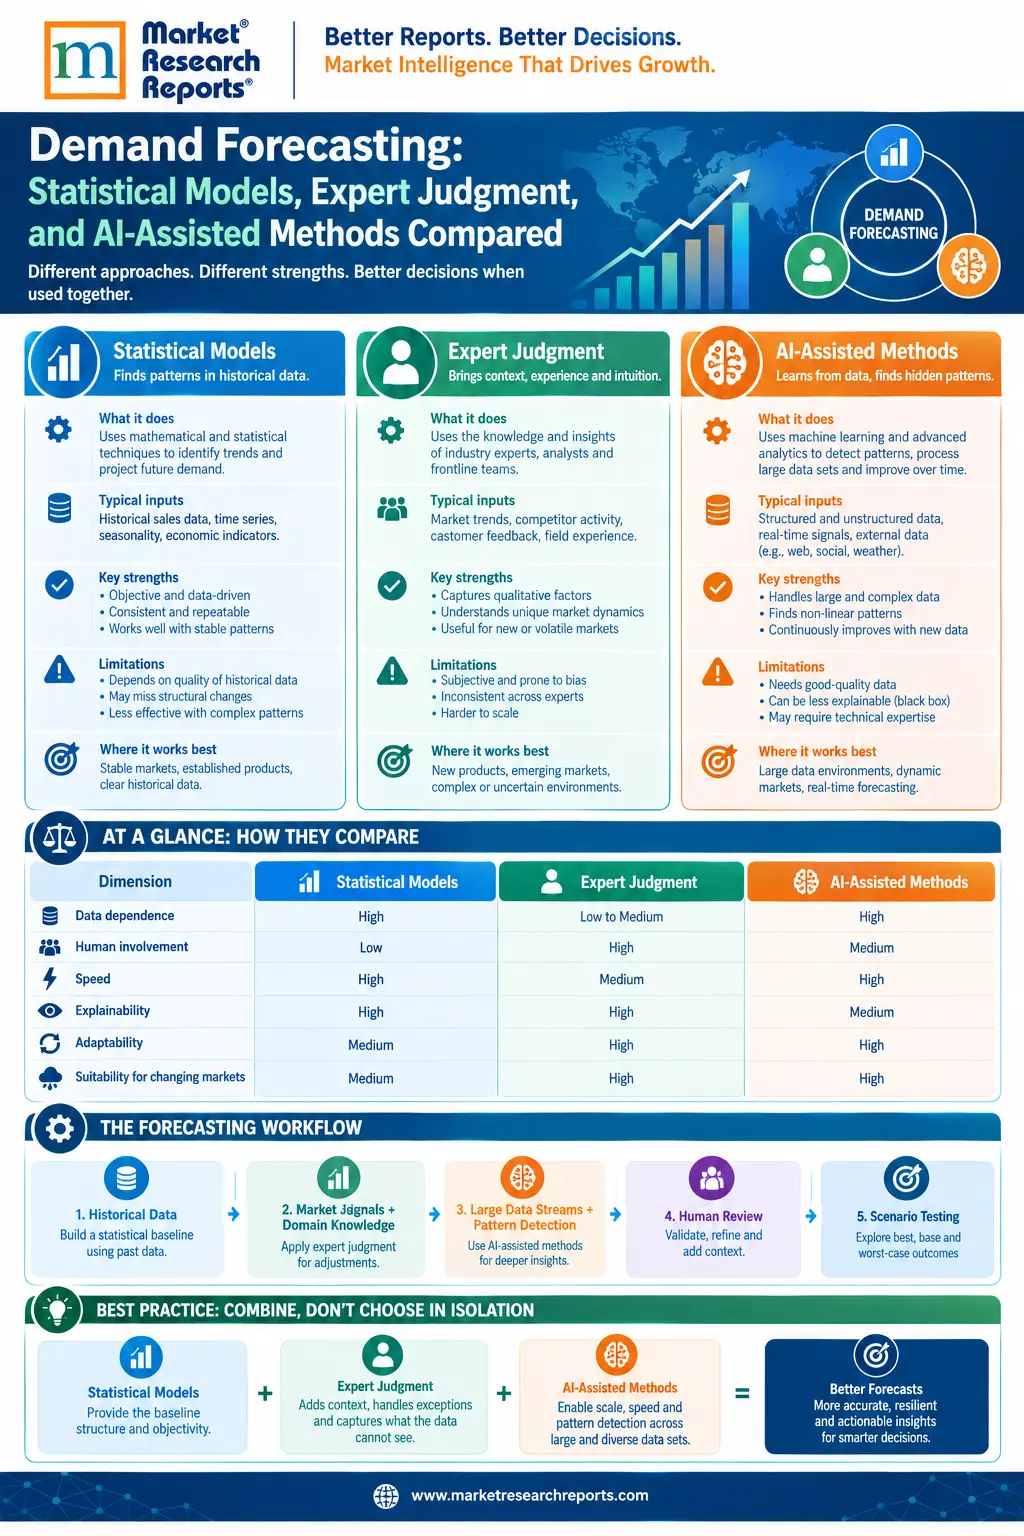
Statistical forecasting methods - moving averages, exponential smoothing, ARIMA models, and regression against external drivers - project future demand primarily from the structure of historical demand data itself, optionally incorporating external variables such as price, seasonality, or macroeconomic indicators.
| Attribute | Detail |
|---|---|
| Best suited to | Stable categories with substantial historical data and no recent structural discontinuity |
| Core assumption | The statistical relationships observed in historical data continue to hold over the forecast horizon |
| Key strength | Highly reproducible, auditable, and fast to update as new data arrives |
| Key limitation | Cannot anticipate a structural break - a pandemic-driven demand spike followed by a return to a different baseline, in Peloton's case - because the method extrapolates from history that does not yet contain the break |
Method 2: Expert Judgment and Delphi-Style Forecasting
Expert judgment methods aggregate structured input from domain specialists, sales leadership, or panel-based Delphi processes, explicitly incorporating context a purely statistical model cannot see - competitive intelligence, anticipated regulatory change, or qualitative read on customer sentiment shifts.
| Attribute | Detail |
|---|---|
| Best suited to | New product categories with limited historical data, or any forecast period spanning an anticipated structural change |
| Core assumption | Domain experts hold relevant information not captured in historical data and can integrate it more accurately than a statistical model alone |
| Key strength | Can incorporate forward-looking, qualitative signals - exactly the kind of structural-shift awareness that would have flagged Peloton's demand normalization risk earlier |
| Key limitation | Subject to well-documented cognitive biases, including anchoring on recent results and optimism bias among the commercial leaders most invested in continued growth |
Method 3: AI-Assisted and Machine Learning Forecasting
Machine learning forecasting methods - gradient-boosted models, neural network approaches, and ensemble methods - can incorporate a far larger set of input variables simultaneously than traditional statistical models, including external signals such as search trend data, social sentiment, and cross-category demand correlation.
| Attribute | Detail |
|---|---|
| Best suited to | High-volume, high-frequency forecasting across many SKUs or markets where the input-variable set is too large for manual statistical modeling |
| Core assumption | Patterns in a large, multi-variable training dataset generalize to future periods, similarly to statistical methods but across far more dimensions simultaneously |
| Key strength | Can detect early-warning correlations across signals a human analyst would not think to test manually |
| Key limitation | Inherits the same blind spot as statistical methods with respect to genuine structural breaks, and is harder to audit and explain to a non-technical decision-maker than either alternative |
Choosing the Right Method: A Decision Framework
| If your situation is... | Use this method (or combination) |
|---|---|
| Stable, mature category with years of consistent historical demand data | Statistical/time-series as the primary method |
| Anticipated structural change to the demand environment (a Peloton-style return to a new baseline, a regulatory shift, a new competitor entry) | Expert judgment as an explicit override layer on top of any statistical baseline |
| New product launch with minimal historical data | Expert judgment, informed by analogous-category statistical benchmarks |
| High SKU count or high-frequency forecasting across many markets | AI-assisted methods, with statistical methods as an audit baseline |
| Any forecast spanning a period where the underlying demand driver itself might change | A blended approach with an explicit, scheduled checkpoint to re-evaluate the structural assumption, not a single point forecast carried forward unchanged |
Analyst Insight:
Peloton's inventory write-down is frequently cited as a cautionary tale about over-reliance on pandemic-era growth extrapolation, but the more precise lesson is about which forecasting method was load-bearing for the decision and when it should have been challenged. A statistical model trained on 2020–2021 demand data was, by construction, going to extrapolate continued high demand - that is what the method does, correctly, with the data it had. The failure was organizational: the point at which expert judgment should have overridden the statistical baseline, specifically challenging the assumption that pandemic-driven exercise-equipment purchasing represented a new permanent baseline rather than a temporary spike, did not happen early enough relative to the production and inventory commitments the company had already made. The $224.9 million inventory reserve adjustment is the financial record of that override happening too late, not of the statistical method itself being wrong on its own terms.
Why Single-Method Forecasting Fails at Structural Turning Points
All three methods share a common vulnerability at the specific moment that matters most for risk management: the period immediately surrounding a structural change in the demand environment. Statistical and AI-assisted methods, however sophisticated, are trained on historical data that by definition does not yet contain the turning point, and will continue projecting the pre-turn trend until enough post-turn data accumulates to visibly shift the model's output - by which point inventory, production, or staffing commitments based on the stale forecast may already be locked in. Expert judgment is theoretically capable of anticipating the turn before the data confirms it, but is equally capable of rationalizing continuation of the existing trend, particularly when the forecast is being reviewed by the same commercial leadership whose recent performance depended on that trend continuing. The practical conclusion is that no single method, used in isolation, reliably protects against this specific failure mode - the protection comes from an explicit governance step requiring expert override authority to be exercised on a fixed schedule, independent of whether the statistical model has yet detected the shift.
A Practical Governance Sequence
- Establish a statistical or AI-assisted baseline forecast as the default starting point for any demand planning cycle, since it is reproducible and auditable.
- Require an explicit expert-judgment review at fixed intervals, not only when someone happens to raise a concern, specifically tasked with answering whether any structural assumption underlying the baseline forecast has weakened.
- Document the specific structural assumptions the baseline forecast depends on, such as "current demand levels reflect a permanent behavior change, not a temporary spike," so the review step in step 2 has a concrete claim to test rather than a vague mandate to "check if anything looks off."
- Tie inventory and production commitments to confidence bands, not point estimates, sizing the most irreversible commitments (long-lead-time manufacturing, multi-year capacity contracts) more conservatively than the point forecast alone would suggest.
- Conduct a post-mortem on every material forecasting miss, explicitly identifying which method produced the miss and whether the override-review step in step 2 occurred and at what point - Peloton's own subsequent restructuring disclosures suggest exactly this kind of process tightening followed the 2022 write-down - a pattern explored further in our companion article on anticipating market shifts.
Market Research Use Cases
- New product demand estimation - combining analogous-category statistical benchmarks with structured expert judgment for categories with no direct historical precedent
- Structural break detection studies - primary research designed specifically to test whether a recent demand pattern reflects a temporary or permanent shift, the precise question Peloton's planning process needed answered earlier
- Multi-market demand modeling - applying AI-assisted methods across a large SKU and geography matrix where manual statistical modeling is impractical
- Inventory and capacity risk assessment - stress-testing production commitments against a range of demand scenarios rather than a single forecast
Frequently Asked Questions
Could better forecasting methodology alone have prevented Peloton's inventory write-down?
Not entirely - the write-down reflects production and inventory commitments made before the structural shift was confirmed, and some lag between a demand peak and the organizational response to it is close to unavoidable; the more realistic goal is shortening that lag through the governance sequence above, not eliminating it.
Is AI-assisted forecasting strictly better than traditional statistical methods?
Not for every use case - AI-assisted methods generally outperform on high-dimensional problems with many input variables and SKUs, but they share the same fundamental blind spot toward structural breaks as simpler statistical methods, and are harder to explain to non-technical stakeholders making the final commitment decision.
How often should the expert-judgment override review happen?
The right cadence depends on the category's volatility and the lead time of the commitments being made - a category with long manufacturing lead times needs more frequent review than one where production can be adjusted quickly in response to early demand signals.
What is the single biggest organizational risk in demand forecasting governance?
Allowing the same commercial leadership whose performance is measured against the existing forecast to also control whether that forecast gets challenged, which creates a structural incentive to delay the override step exactly when it is most needed.
Does this framework apply equally to B2B and consumer demand forecasting?
Yes, though the specific signals used to detect a structural break differ - B2B forecasting often has earlier warning signals available through direct account-level pipeline visibility, while consumer forecasting frequently depends more heavily on indirect signals like search trends and sentiment data.
To commission a structural break detection study or demand scenario model for your category, contact our custom research team. For established category-level demand data, browse our syndicated report library.