


The AI Industry's Pricing Problem: How Token Economics Diverged While Capital Expenditure Outpaced Revenue Across the Sector
The AI Industry's Pricing Problem: How Token Economics Diverged While Capital Expenditure Outpaced Revenue Across the Sector
MRR® Industry Intelligence Briefing Artificial Intelligence · Pricing Strategy · Capital Markets
The question investors are actually asking in 2026 is not whether AI inference will eventually be profitable - it is which companies can survive long enough to find out. In 2025 alone, the four largest hyperscalers committed roughly USD 410 billion to AI infrastructure, while the two largest standalone model providers posted a combined operating loss exceeding USD 20 billion against barely a fifth of that figure in revenue between them. This briefing examines the token-pricing architecture, customer-mix differences, and capital structures behind that divergence - and why a single chip supplier sitting beneath all six AI labs in this analysis is, so far, the only party in the value chain making money at scale. Here are some of the key findings from our comparative analysis of OpenAI, Anthropic, Google, Microsoft, Meta, and Nvidia.
Executive Summary
In 2025, the four largest hyperscalers - Microsoft, Amazon, Alphabet, and Meta - spent a combined $400–410 billion on capital expenditure, the overwhelming majority directed at AI data centers, custom silicon, and GPU capacity. That figure is guided to rise to roughly $725 billion in 2026, an increase of 77% in a single year. Set against that capital base, the two largest pure-play AI model providers reported starkly different outcomes: OpenAI recorded $13.1 billion in 2025 revenue against a $20.9 billion operating loss - a deterioration of 138% year-over-year despite revenue growing 250% - while Anthropic closed 2025 at a $9 billion annualized revenue run rate and, by April 2026, had nearly tripled that to over $30 billion, overtaking OpenAI's reported run rate entirely. Both companies sell substantially the same product - API access to large language models, priced per token - into the same buyer base. The divergence in their financial trajectories is not explained by model quality alone. It is explained by differences in pricing architecture, customer mix, and capital discipline that constitute one of the clearest natural experiments available in technology pricing strategy today. This briefing examines the problem from the vantage point of the industry as a whole: a sector spending capital at a rate with no precedent in corporate history, a single supplier (Nvidia) capturing the overwhelming share of realized profit, and a pricing structure that several major labs are now actively reconsidering as a defensive measure rather than a growth lever.
The Research Problem: An Industry Spending Faster Than It Can Price Its Product
Every prior infrastructure buildout in technology history - telecom fiber in the late 1990s, cloud computing data centers in the 2010s - eventually settled into a pricing model where unit economics could be observed, benchmarked, and modeled forward with reasonable confidence. The AI industry has not yet reached that point, and the capital intensity of the buildout is occurring before, not after, that pricing question has been resolved.
The core analytical problem facing any analyst examining this sector is a denominator mismatch. Capital expenditure is being deployed at the infrastructure layer - by Microsoft, Amazon, Alphabet, and Meta - on a multi-year depreciation schedule, justified by projected future demand for AI compute across the whole economy. Revenue is being generated at the application and model layer - by OpenAI, Anthropic, and the hyperscalers' own first-party AI products - on a per-token, per-seat, or per-API-call basis that resets every billing cycle. These two layers are financially linked (the infrastructure providers are also substantial investors in and counterparties to the model providers) but report through entirely separate financial statements, on different accounting timelines, making industry-wide profitability genuinely difficult to assess from any single company's results.
Compounding the problem, public reporting on model-provider economics is unusually opaque relative to revenue scale. OpenAI's audited 2025 financials only became visible through a leaked document reviewed by the Financial Times in mid-2026, ahead of an anticipated IPO. Anthropic's revenue figures are self-reported annualized run rates rather than audited trailing-twelve-month GAAP revenue, and the company books reseller revenue from AWS and Google Cloud on a gross basis - a methodology OpenAI has publicly disputed as overstating Anthropic's comparable revenue by roughly $8 billion. Neither company will resolve this ambiguity definitively until both file public IPO prospectuses, expected later in 2026.
The Research Approach: Triangulating Across Four Layers of the AI Stack
Given the absence of a single authoritative pricing benchmark, building an industry-wide view requires triangulating across four distinct vantage points simultaneously, rather than relying on any one company's disclosures:
- The compute supplier layer. Nvidia's quarterly and annual segment reporting is the single most reliable, audited data source in the entire AI economy, since GPU revenue recognition is comparatively simple relative to subscription or usage-based AI services. Nvidia's Data Center segment results function as an industry-wide demand proxy independent of any model provider's own accounting choices.
- The infrastructure layer. Capital expenditure guidance and actuals reported by Microsoft, Amazon, Alphabet, and Meta in their quarterly SEC filings provide an audited, if forward-looking, view of aggregate industry investment - the denominator against which model-layer revenue must eventually be judged.
- The model-provider layer. OpenAI and Anthropic's revenue and loss disclosures, where available, even when self-reported or only partially audited, remain the most direct evidence of whether per-token pricing is actually generating sustainable unit economics at the point of sale.
- The pricing-architecture layer. Published rate cards across providers - input/output token pricing, prompt caching discounts, batch processing rates, subscription tiers - reveal how each company is structurally choosing to monetize the same underlying compute cost base, which is the variable most directly within each company's own control.
What the Research Revealed: Three Divergences That Explain the Industry's Profitability Gap
Divergence 1 - Customer Mix Determines Margin Trajectory, Not Model Quality Alone
The single most consequential difference between OpenAI's and Anthropic's financial trajectories is customer composition, not underlying model capability. Anthropic reports that enterprise and business customers account for approximately 80% of revenue, with the number of customers spending over $1 million annually surpassing 1,000 by April 2026, up from roughly a dozen two years earlier. OpenAI's revenue, by contrast, remains heavily weighted toward consumer ChatGPT subscriptions - a segment where, as of October 2025, only about 5% of weekly active users were paying customers, meaning the company's costs of serving free users were being cross-subsidized by a comparatively small paying base. Enterprise API revenue at high per-customer values carries structurally better unit economics than mass-market consumer subscriptions, because enterprise customers are less price-sensitive, more workload-predictable, and cheaper to acquire per dollar of revenue once a relationship is established. Anthropic's bet on enterprise-first distribution - anchored by Claude Code, which reached $1 billion in annualized revenue within six months of its May 2025 launch and surpassed $2.5 billion by February 2026 - is the clearest evidence that pricing architecture and go-to-market sequencing, not model benchmarks, are the dominant variable explaining the two companies' diverging loss curves.
Divergence 2 - The Supplier Layer Is Capturing the Profit the Model Layer Cannot Yet Generate
Nvidia's fiscal 2026 results (year ended January 25, 2026) show $215.9 billion in total revenue, up 65% year-over-year, with a GAAP gross margin of 71.1% and $120 billion in net income for the year - a 65% increase in profitability over the prior fiscal year. This single company's annual net income now exceeds the combined 2025 revenue of every major AI model provider put together. The structural reason is straightforward: Nvidia sells a physical, scarce, repeatably-priced product (GPUs and networking) into a buyer base that is currently price-insensitive due to capacity constraints, while OpenAI and Anthropic sell a service whose price is being actively compressed by competitive pressure even as their underlying compute costs rise. The industry's realized profit pool, in other words, is currently concentrated almost entirely at the infrastructure supplier layer rather than at the application layer where the bulk of capital is being deployed to build new revenue.
Divergence 3 - Capex Guidance Has Decoupled From Any Published Return-on-Investment Framework
Combined hyperscaler capex of roughly $410 billion in 2025, rising to a guided $725 billion in 2026, is being funded at a rate that is beginning to outpace operating cash flow at several of the four companies. Industry analysts at Bank of America and Mizuho have estimated that AI-related capital expenditure could rise to as much as 94% of aggregate operating cash flow (after dividends and buybacks) across the major hyperscalers in 2025–2026, up from 76% in 2024 - a trajectory that, if it continues, brings these companies close to needing external financing to sustain the buildout. Alphabet's Google Cloud backlog reaching $462 billion by Q1 2026, roughly double the prior year, is the strongest publicly disclosed evidence that at least one hyperscaler has forward revenue visibility commensurate with its spending. Meta's capex, by contrast, drew explicit investor skepticism after the company raised its 2026 guidance to $125–145 billion without a comparably scaled disclosure of contracted forward revenue, with its stock falling more than 6% after the announcement and analysts at Jefferies writing that the company "likely remains in the penalty box pending clearer capex ROI."
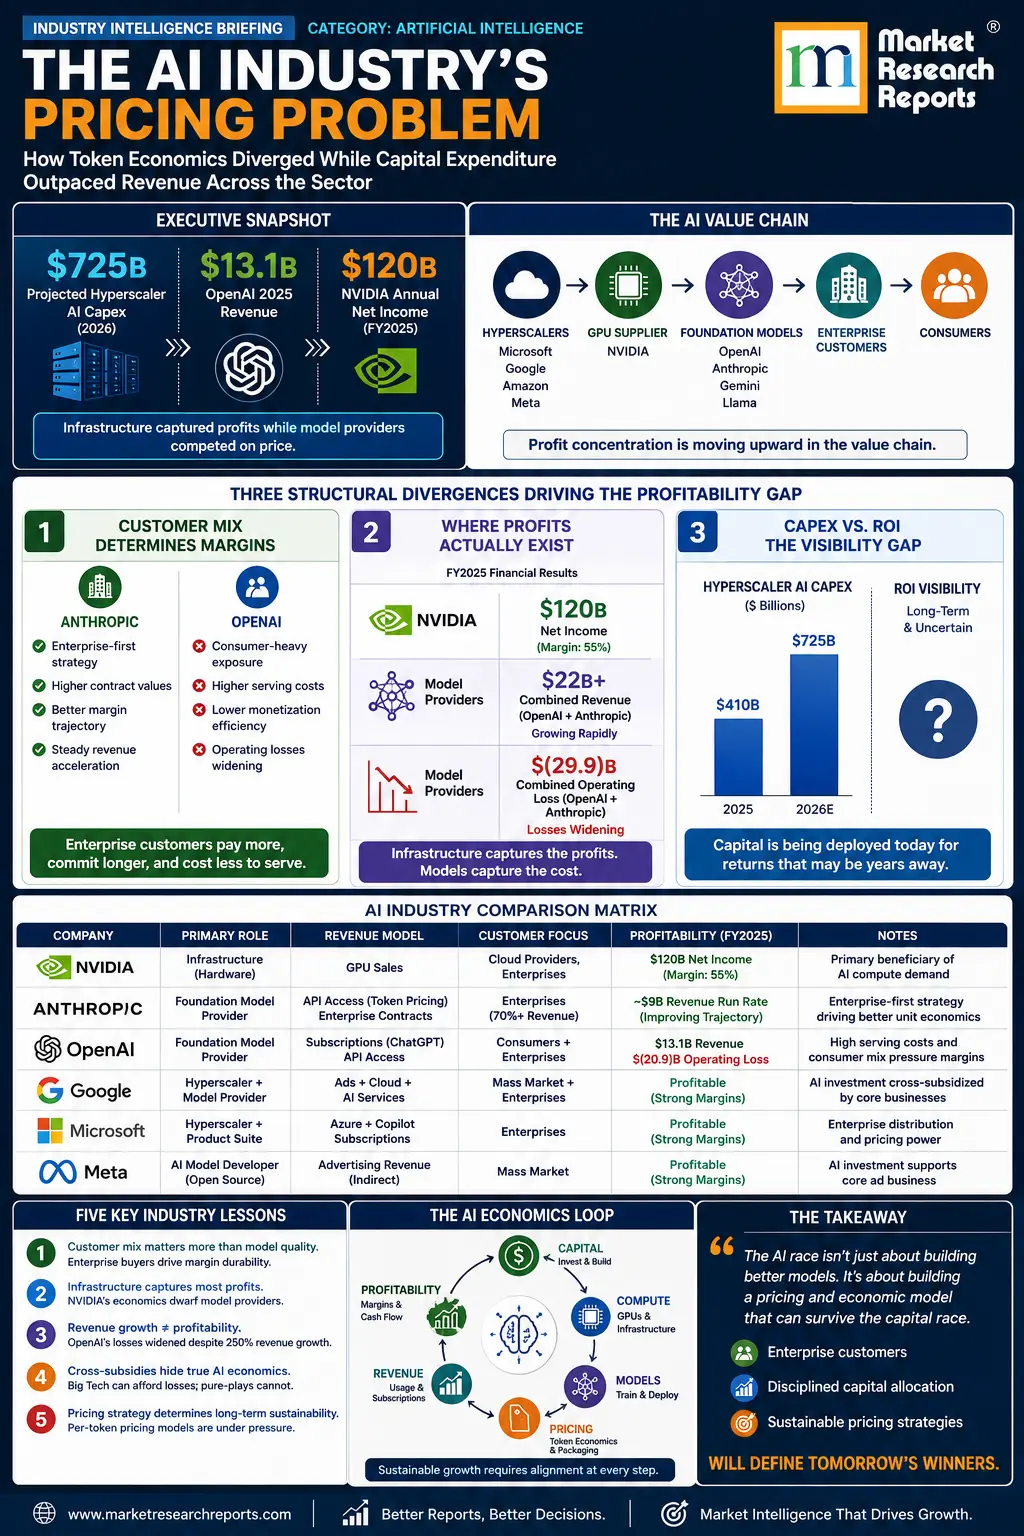
Comparative Analysis: How the Leading AI Players Are Pricing and Funding Their Position
| Company | Core AI Revenue Model | Reported 2025 Revenue / Run Rate | Reported 2025 Profitability | 2025–2026 Capex Commitment | Pricing Strategy |
|---|---|---|---|---|---|
| OpenAI | Consumer ChatGPT subscriptions (Plus/Pro) + enterprise/API per-token pricing | $13.1B 2025 revenue; ~$20–25B annualized run rate by Q1 2026 | $20.9B operating loss (2025); $38.5B net loss including one-time for-profit conversion accounting charge | ~$1.4 trillion in multi-year compute purchase commitments disclosed (Microsoft, Oracle, Broadcom, others) | Consumer-subsidized model; considering token price cuts in 2026 to defend share against Anthropic and Gemini |
| Anthropic | Enterprise/API per-token pricing (~80% of revenue) + Claude Code agentic coding product | $9B run rate end-2025; $30B+ run rate by April 2026 | Not publicly disclosed in GAAP terms; CEO has stated the gap between "transcendent success and insolvency is measured in quarters" | $30B Azure compute commitment from Microsoft/Nvidia investment package; additional Google Cloud and Broadcom TPU capacity secured for 2027+ | Enterprise-first; asymmetric input/output token pricing with prompt caching (up to 90% discount) and batch discounts (50%) |
| Google / Alphabet (Gemini) | First-party Gemini API + Search/Cloud AI integration, funded by core advertising profit | Google Cloud revenue $20B in Q1 2026 alone, up 63% YoY; AI Overviews embedded in $60.4B quarterly Search revenue | Alphabet-wide net income $62.6B (most recent quarter), up 81% YoY - only major lab operating at a group-level profit | $91–93B (2025 actual); $180–190B guided for 2026 | Vertically integrated - custom TPU silicon reduces per-token cost versus GPU-dependent rivals; aggressive pricing enabled by ad-revenue cross-subsidy |
| Microsoft (Copilot/Azure AI) | Azure AI infrastructure resale + Copilot per-seat subscription | Microsoft AI business surpassed $13B annualized run rate (up 175% YoY) as of early 2025; Azure overall grew 40% | Group-level highly profitable ($27.2B net income, Q4 FY2025) but AI-specific margin not separately disclosed | Guided ~$190B for calendar 2026, up from a fiscal Q4 2025 quarterly run rate of $24.2B | Hybrid - resells OpenAI capacity via Azure while selling first-party Copilot seats (20M+ paid seats, up 250% YoY) |
| Meta (Llama) | Open-weight models, monetized indirectly via improved ad targeting and Meta AI engagement, not direct API sales | No direct AI product revenue disclosed; monetization is entirely indirect through core advertising business | Meta Platforms group-level profitable; capex-to-revenue ratio drawing the most investor skepticism of the four hyperscalers | $72B (2025 actual); raised to $125–145B guidance for 2026 | Zero direct token pricing - gives model weights away to commoditize the layer competitors are trying to monetize directly |
| Nvidia | GPU and networking hardware sales to all of the above | $215.9B (FY2026, ended Jan 2026), up 65% YoY | $120B net income, 71.1% GAAP gross margin - the only company in this table with profit exceeding peers' combined revenue | Not a capex spender at this scale - captures the spending of all six other rows as revenue | Hardware pricing power sustained by capacity constraints; introduced Rubin platform claiming up to 10x inference token-cost reduction for customers |
Figures represent the most recently disclosed full-year or run-rate data as of mid-2026 and combine audited (10-K/10-Q, SEC filings) and company-disclosed (earnings calls, investor letters) sources, which vary in reporting standard between providers; see individual company notes above.
The Pricing Decision and Outcome: A Sector Bifurcating Into Two Strategies
The comparative table above reveals that the AI industry has not converged on a single pricing philosophy the way the case study of Anthropic's own per-token rate card structure might suggest in isolation. Instead, two distinct strategic postures have emerged at the industry level:
Direct monetization, enterprise-weighted. Anthropic's strategy - and increasingly OpenAI's stated direction for 2026 - is to price per-token API access directly to the heaviest, most predictable enterprise workloads, accept that consumer subscription economics alone cannot fund frontier model development, and use enterprise contract value to subsidize continued model research. This is the only strategy among the group attempting to make the model layer profitable on a standalone basis, and it is the strategy under the most acute near-term financial pressure, evidenced by OpenAI's widening losses and Anthropic's own CEO publicly describing the company's survival margin in quarters rather than years.
Cross-subsidized monetization, platform-weighted. Google, Microsoft, and Meta are each pricing AI access - Gemini, Copilot, and Llama respectively - not as a standalone profit center but as a feature embedded in or adjacent to an already-profitable core business: Search advertising, Office/Azure subscriptions, and the Meta advertising engine. This structurally insulates each from needing the AI product line itself to clear a profitability bar in the near term, which is precisely why Alphabet is the only company in the comparative table reporting group-level profit growth alongside its AI buildout. The trade-off is that none of these three has demonstrated, through public disclosure, what the AI product line would earn if forced to stand alone - a question that becomes financially material the moment internal cross-subsidy budgets are reallocated elsewhere.
The emergence of a price war scenario in early 2026 - with OpenAI reportedly considering token price cuts specifically in response to anticipated moves by Anthropic, according to Wall Street Journal reporting - is the clearest signal yet that the direct-monetization strategy is approaching a structural ceiling. A price war between the two largest standalone model providers, neither of which has yet demonstrated standalone profitability, compresses the one lever (price) that was supposed to close the gap between revenue and the capital being deployed against it.
Strategic Lessons for Market Researchers and Industry Analysts
| Lesson | Application |
|---|---|
| Revenue growth and profitability are not the same signal in capital-intensive new categories | A company can post 250% revenue growth (OpenAI, 2025) and simultaneously post the largest single-year operating loss escalation in technology history; growth-rate analysis alone is an insufficient diligence signal in infrastructure-dependent sectors |
| Customer mix is often a stronger profitability predictor than product quality | Anthropic's enterprise-weighted revenue base, not a demonstrable model-quality gap, is the best-evidenced explanation for its comparatively stronger trajectory relative to OpenAI's consumer-heavy mix |
| Track the supplier layer, not just the application layer, to find where industry profit actually sits | In this case, Nvidia's $120 billion in annual net income - captured almost entirely from the same capital flows funding OpenAI's and Anthropic's losses - shows that "the AI industry is unprofitable" and "AI infrastructure is extremely profitable" are simultaneously true statements about different layers of the same value chain |
| Cross-subsidized pricing can mask the true unit economics of a product line for years | Google, Microsoft, and Meta's AI offerings benefit from accounting and strategic cover that standalone model providers like OpenAI and Anthropic do not have access to, making like-for-like profitability comparisons across the sector structurally difficult without segment-level disclosure that most companies do not provide |
| Capex guidance disconnected from disclosed forward revenue is a material risk signal | Alphabet's $462 billion Cloud backlog disclosure drew a positive market reaction precisely because it is the kind of forward-revenue evidence that justifies capex at scale; Meta's capex increase without a comparable disclosure drew the opposite reaction, illustrating that the market itself is actively pricing this distinction |
Frequently Asked Questions
Why did OpenAI's losses grow faster than its revenue in 2025?
OpenAI's cost of revenue rose from $2.65 billion in 2024 to $7.5 billion in 2025, reflecting the rising cost of serving inference at scale, while sales and marketing expenses rose from $1.11 billion to $5.73 billion in the same period as the company fought to defend user growth against Anthropic and Google. Revenue grew 250% year-over-year, but the underlying cost base - much of it tied to long-term compute purchase commitments - grew even faster, widening the operating loss from $8.78 billion in 2024 to $20.92 billion in 2025.
Is Anthropic actually profitable?
Anthropic has not published audited GAAP profitability figures. CEO Dario Amodei has publicly stated that the gap between "transcendent success and insolvency is measured in quarters," which indicates the company itself does not consider current profitability assured even at a $30 billion-plus run rate, despite its structurally more favorable enterprise-weighted revenue mix relative to OpenAI.
Why is Nvidia more profitable than every AI model company combined?
Nvidia sells the physical infrastructure layer - GPUs and networking hardware - into a market currently constrained by supply rather than demand, allowing it to sustain a 71.1% gross margin. OpenAI and Anthropic sell a service layer where price is being actively compressed by direct competition between the two largest providers, even as the underlying compute costs both companies pay (much of it to Nvidia, directly or via cloud providers) continue to rise.
Will the reported AI price war actually happen?
As of mid-2026, reporting indicates OpenAI is actively considering token price cuts in anticipation of similar moves from Anthropic, rather than either company having confirmed a specific reduction. Given that neither company has demonstrated standalone GAAP profitability at current prices, a price war would compress the primary lever each was relying on to close its respective revenue-to-cost gap, making this one of the more consequential open questions for the sector's path to profitability through 2027.
How should an analyst assess whether AI infrastructure capex is justified?
The clearest evidence available is forward revenue backlog disclosure, not capex size alone. Alphabet's $462 billion Google Cloud backlog - roughly double its prior-year figure - is the strongest publicly available signal that at least one hyperscaler's spending is matched by contracted future demand; the absence of comparable disclosure at Meta is what is driving investor skepticism of that company's capex trajectory specifically, independent of the AI capex story industry-wide.
For ongoing coverage of AI infrastructure economics and pricing strategy, browse our syndicated report library covering AI infrastructure, GPU/accelerator markets, and enterprise generative AI platforms, or commission custom research scoped to your organization's specific AI capex or vendor-selection question.