


The Trillion-Dollar Company That Didn't Exist Two Years Ago
The Trillion-Dollar Company That Didn't Exist Two Years Ago
MRR® Industry Intelligence Briefing Pharmaceuticals · GLP-1 · Market Analysis
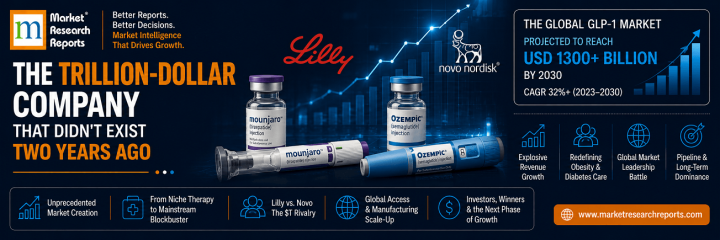
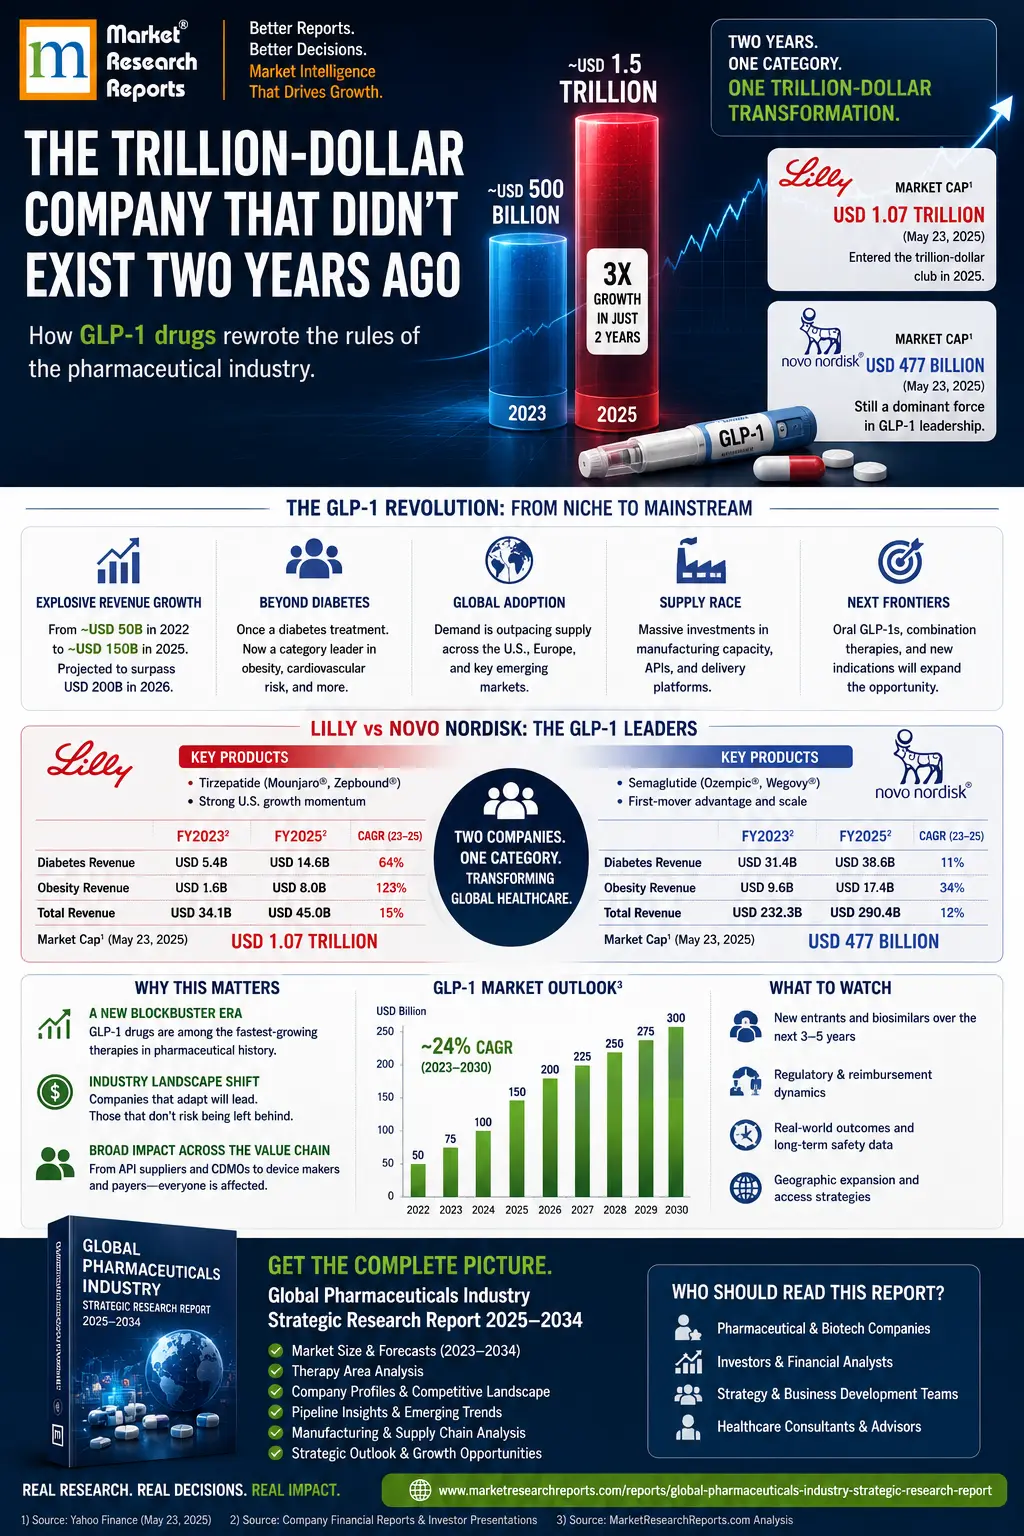
In August 2026, Eli Lilly's market capitalization crossed $1 trillion - the first healthcare company in history to reach that threshold. Two years earlier, Lilly was a solid, mid-pack pharmaceutical major, not the kind of company market analysts described in the same breath as Apple or Microsoft. The company that made that jump didn't do it by inventing a new blockbuster drug category from nothing. It did it by winning a fight most people didn't realize was happening, against a company that many assumed had already won it.
Executive Summary
The global pharmaceutical consumption market is estimated at $1.65 trillion in 2025, projected to reach $2.45 trillion by 2031 - a 6.8% compound annual growth rate, according to Navadhi Market Research's Global Pharmaceuticals Industry Strategic Research Report 2026-2031. This is a material acceleration from the 4.3% CAGR recorded over 2022-2024, and the single largest contributor to that acceleration is GLP-1 receptor agonist and cardiometabolic franchise expansion, estimated to add approximately $280 billion of incremental consumption value by 2031. Twenty-five companies are profiled in depth, and the competitive story inside that $280 billion figure - Eli Lilly's real, disclosed 45% revenue surge against Novo Nordisk's real, disclosed guidance cut - is the clearest illustration in the entire pharmaceutical industry of how fast a category leadership position can actually change hands.
The Research Problem: How Do You Size a Market Where the Leader Changed Mid-Year?
Sizing a $1.65 trillion market sounds like it should be a matter of adding up known revenue figures. The harder problem is that pharmaceutical company rankings are not static, and a report built on stale assumptions produces a genuinely wrong picture of the competitive landscape, not just an outdated one.
The clearest case in this cycle is Novo Nordisk. As recently as early 2025, Novo Nordisk's GLP-1 franchise (semaglutide, marketed as Ozempic and Wegovy) was widely treated as the category-defining, hardest-to-dislodge position in pharmaceuticals. The obesity and diabetes drug market was, for a period, effectively a two-name conversation, and Novo Nordisk was the name people said first.
That changed. Novo Nordisk's real, disclosed 2026 guidance shows adjusted operating profit growth of 0% to -6% - a guidance cut, not a slowdown in growth, an actual contraction - following approximately 9,000 confirmed job cuts and intensifying competitive pressure specifically from Eli Lilly's tirzepatide franchise (marketed as Mounjaro and Zepbound). Novo Nordisk's real FY2025 revenue growth, adjusted for currency effects, was close to flat in US dollar terms.
Meanwhile, Eli Lilly's real, disclosed FY2025 revenue reached $65.2 billion, up 45% year-over-year - an extraordinary growth rate for a company already operating at tens of billions of dollars in scale, not a small-base percentage illusion. The company's 2026 guidance has been raised to $85-87 billion. And in August 2026, Lilly's market capitalization crossed $1 trillion, a threshold no healthcare company had reached before.
A market report that treated "Novo Nordisk leads GLP-1" as a durable fact, because it was true eighteen months ago, would have gotten the single most important competitive dynamic in the entire $1.65 trillion market wrong.
The distortion compounds when it isn't caught early. A stale competitive ranking doesn't just mislabel one company - it propagates into every downstream analysis that assumes it: market share calculations, growth-driver attribution, regional forecasts weighted by company presence, even company-level financial projections built by extrapolating a trailing growth rate that no longer applies. Getting the Lilly/Novo Nordisk dynamic right isn't a nice-to-have footnote in this report - it is a load-bearing assumption underneath the entire $280 billion GLP-1 growth estimate, since that figure depends on correctly modeling how fast the category's two largest competitors are actually growing today, not how fast either was growing when a prior analysis was last updated.
Three Forces Behind the Market's 6.8% Growth Rate
Force 1 - GLP-1 and Cardiometabolic Expansion Is the Single Largest Growth Contributor
At an estimated $280 billion of incremental consumption value by 2031, the GLP-1/cardiometabolic franchise alone represents more incremental growth than most entire national pharmaceutical markets. This is not a niche category expanding from a small base - it is one of the largest single demand shifts in the modern history of the pharmaceutical industry, and the competitive positioning within it (Lilly vs. Novo Nordisk, and an emerging wave of follow-on molecules from other manufacturers) will meaningfully shape overall market share for the rest of the decade.
Force 2 - Oncology Innovation Continues at a Structurally Elevated Pace
Beyond GLP-1, sustained oncology pipeline readouts and approvals continue converting into commercial revenue at a pace that keeps this category among the largest and most durable growth contributors in the market, independent of the cardiometabolic story.
Force 3 - The Post-COVID Base Effect Has Fully Worked Through the System
The 2022-2024 historical CAGR of 4.3% was artificially suppressed by post-COVID-19 vaccine demand normalization and inventory destocking following the demand anomalies of 2021-2022. That drag is now complete, meaning the 6.8% forecast CAGR is not primarily a comparison against an unusually weak base - it is a genuine acceleration in underlying demand.
This distinction matters for anyone using the historical CAGR as an input to a separate forecasting exercise. A naive model that simply extrapolates the trailing 4.3% rate forward will systematically understate 2025-2031 growth, because it implicitly assumes the COVID-era demand suppression continues indefinitely rather than recognizing it as a one-time, now-completed adjustment.
The Competitive Landscape: Real Figures, Not Legacy Rankings
| Company | FY2025 Revenue | YoY Growth | Real, Confirmed Development |
|---|---|---|---|
| Eli Lilly | $65.2B | +45% | Market cap crossed $1 trillion, August 2026 - first healthcare company ever |
| Novo Nordisk | Near-flat (USD) | ~0% | 2026 guidance cut to 0% to -6%; ~9,000 job cuts confirmed |
| Johnson & Johnson | $94.2B | +6.0% | 2026 guidance raised to $100.8-101.4B |
| Merck & Co. | $65.0B | +1.0% | Stable, mature growth profile |
| AbbVie | $61.2B | +8.6% | Skyrizi alone now $17.6B; Humira down to $4.5B post-patent-cliff |
| Pfizer | $62.6B | +2.0% | Post-COVID revenue base fully normalized |
Source: Navadhi Market Research, Global Pharmaceuticals Industry Strategic Research Report 2026-2031; company FY2025 disclosures.
Analyst Insight
The AbbVie line in that table is worth sitting with for a moment, because it tells the same kind of story as the Lilly/Novo Nordisk shift, just inside a single company rather than between two competitors. Humira was, for most of the 2010s, the best-selling drug in the world. It is now generating $4.5 billion, a fraction of its peak, following patent expiration and biosimilar competition. AbbVie's real answer to that decline was not a single replacement blockbuster - it was Skyrizi, now at $17.6 billion, nearly four times Humira's current run rate. The lesson embedded in both the AbbVie transition and the Lilly/Novo Nordisk shift is the same: in a $1.65 trillion market growing at 6.8% a year, the aggregate number tells you almost nothing about where the real risk and opportunity sit. The composition underneath it changes fast enough that a report built on an eighteen-month-old snapshot of "who's winning" will actively mislead a reader, not just slightly underserve them.
Strategic Lessons for Market Participants
| Observation | Strategic Implication |
|---|---|
| Category leadership in GLP-1 shifted meaningfully within an 18-month window | Competitive analysis in fast-moving therapeutic categories needs a refresh cadence measured in quarters, not years |
| AbbVie replaced its largest-ever product with a new franchise nearly 4x its current scale | Patent-cliff exposure should be evaluated against a company's demonstrated replacement-franchise track record, not just the cliff's raw dollar size |
| The 2022-2024 historical CAGR (4.3%) understates genuine underlying demand due to COVID base effects | Forecast models built directly on trailing historical CAGRs without adjusting for one-time demand distortions will underestimate forward growth |
| $280B of the $795B total forecast increment comes from one therapeutic category | Portfolio and investment decisions should weight GLP-1/cardiometabolic exposure heavily relative to its share of overall market growth, not just its share of current market size |
Frequently Asked Questions
What is the size of the global pharmaceutical consumption market?
The market is estimated at $1.65 trillion in 2025, projected to reach $2.45 trillion by 2031, a compound annual growth rate of approximately 6.8%, up from a 4.3% historical CAGR over 2022-2024.
Is Eli Lilly now larger than Novo Nordisk in the GLP-1 market?
Lilly's FY2025 revenue growth (+45% to $65.2 billion) significantly outpaced Novo Nordisk's (near-flat in USD terms), and Lilly's 2026 guidance ($85-87 billion) reflects continued acceleration while Novo Nordisk's guidance reflects a real contraction (0% to -6% adjusted growth). The two companies' overall total revenue figures include substantial non-GLP-1 business in both cases, but within the GLP-1/cardiometabolic category specifically, the growth trajectories have clearly diverged in Lilly's favor as of 2026.
What is driving the market's acceleration from 4.3% to 6.8% CAGR?
Five structural forces, the largest being GLP-1 receptor agonist and cardiometabolic franchise expansion, estimated to add approximately $280 billion of incremental value by 2031. The 2022-2024 period was also artificially suppressed by post-COVID-19 demand normalization, a drag that has now fully worked through the system.
Which companies are profiled in this report?
Twenty-five companies including Johnson & Johnson, Pfizer, Roche, Merck, AbbVie, Novartis, AstraZeneca, Sanofi, Bristol-Myers Squibb, Eli Lilly, GSK, Novo Nordisk, Takeda, Bayer, Boehringer Ingelheim, Amgen, Gilead, Vertex, Regeneron, Biogen, Moderna, Teva, Viatris, Sun Pharma, and Dr. Reddy's Laboratories.
How does this report relate to the companion Manufacturing report?
This report covers pharmaceutical CONSUMPTION - demand-side, end-market revenue. A separate companion report covers pharmaceutical MANUFACTURING - the production and supply-side capacity required to meet that demand, including the significant capital investment underway specifically to scale GLP-1 manufacturing capacity.
For full market sizing, segment and regional detail, and all twenty-five company profiles, see our Global Pharmaceuticals Industry Strategic Research Report 2026-2031. For the supply-side view of this same market, see our companion Global Pharmaceuticals Manufacturing Market Strategic Research Report. For bespoke pharmaceutical market analysis, commission custom research.