


A Single HS Trade Code Is Hiding Two Different Food Peptide Businesses. Here's the $2.50-to-$42/kg Spread That Proves It.
A Single HS Trade Code Is Hiding Two Different Food Peptide Businesses. Here's the $2.50-to-$42/kg Spread That Proves It.
MRR® Industry Intelligence Briefing Food Ingredients · Functional Nutrition · Trade Analysis
Every food-peptide market report leads with the same number: a market growing at a healthy-sounding 7.8% a year. What it doesn't tell you is that a kilogram of the same broad category of ingredient can sell for $2.50 or $42 depending on where it crosses a border - and that gap is the real story, not the growth rate.
Executive Summary
The global food peptide market reached an estimated USD 5.13 billion in 2025 and is projected to grow at a 7.8% CAGR through 2031, according to Navadhi Market Research's Global Food Peptide Market Strategic Research Report, cross-validated against Global Market Insights' independently published estimate. Eleven manufacturers are profiled in depth, and the more useful story for anyone assessing this space isn't the blended growth figure - it's three structural patterns sitting beneath it: a genuine two-tier pricing structure hiding inside a single HS trade code, a Asia-Pacific region that's simultaneously the largest market and the hardest to read from trade data alone, and a real, measurable trade-balance split between exporters and importers that most market sizing reports never surface.
The Research Problem: A Single Growth Number Covering Two Different Businesses
"Food peptides" sounds like one ingredient category. It isn't. Animal-based peptides - dairy, fish, and meat-derived - account for just over half the market by value (50.7%, USD 2.60 billion in 2025), while plant-based, marine, and microbial/fermentation-derived sources split the rest. These aren't minor formulation variants of the same product; they're different raw-material supply chains, different manufacturing processes, and - as real UN Comtrade trade data confirms - different price points entirely.
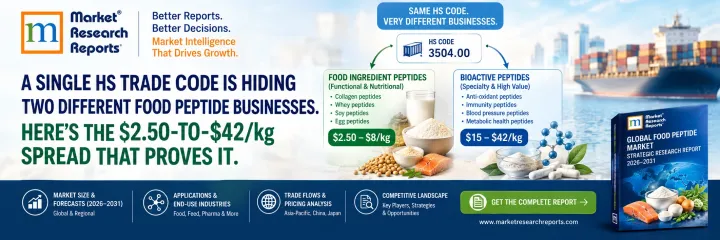
The shift most underweighted in generalist coverage is what real, directly-pulled UN Comtrade trade data (HS code 3504, "peptones and their derivatives") reveals about pricing that no market-sizing report captures on its own: implied per-kilogram export pricing across 13 reporting countries in 2024 ranges from approximately $2.50/kg (commodity-grade Chinese exports) to $42/kg (premium refined Japanese re-exports) - a nearly 17x spread within a single customs classification.
Three Structural Patterns, Three Different Reads on the Market
Pattern One - The Trade Data Reveals a Real Winner-Loser Split That Value-Only Reports Miss
China is the largest net exporter among reporting countries in this category, running an estimated $658 million trade surplus in 2024. Japan is the largest net importer, at roughly -$274 million. That's not a coincidence of scale - it reflects two genuinely different positions in the supply chain: China exporting bulk, commodity-grade peptide ingredients at the low end of that $2.50-$42/kg range, and Japan importing higher-value refined material for domestic reformulation and re-export at the premium end. A market-value report alone would show both countries as simply "large markets." The trade data shows they're playing opposite roles in the same supply chain.
Pattern Two - Asia Pacific Is the Largest Region, But "Asia Pacific" Isn't One Market
Asia Pacific holds the largest regional share at 34.5% (USD 1.77 billion, 2025), anchored by China, Japan, South Korea and India. But those four countries don't move together: China is the production and export hub, Japan is a net importer refining for higher-value use, South Korea shows the fastest recent export growth of any reporting country in this category, and India - despite limited trade-data visibility - is explicitly named by GMI's own published research as a key growth driver. Treating "Asia Pacific" as a single demand signal misses that it's actually four distinct competitive positions operating under one regional label.
Pattern Three - Growth Momentum Doesn't Track Market Size
The countries gaining share fastest in real export data aren't the largest existing players. Canada (+20.8% CAGR, 2020-2024), South Korea (+19.8%) and Brazil (+18.8%) all posted export growth well above the category's ~8% blended value CAGR - meaning smaller-base exporters are taking share from the incumbents, not just riding the same tide. For anyone assessing where new manufacturing capacity or trade relationships are forming, these growth-rate leaders are a more useful signal than the current size leaderboard.
Where the Key Manufacturers Sit
| Company | Primary Position | What to Watch |
|---|---|---|
| Kerry Group | Diversified functional ingredient major; dairy- and plant-derived peptide portfolio | Continued reallocation toward higher-margin bioactive/functional ingredient lines |
| GELITA AG | Collagen peptides, gelatin; food and nutraceutical applications | Positioning against post-merger Rousselot/PB Leiner capacity scale |
| Rousselot / Darling Ingredients | Collagen peptides (Peptan brand); post-merger with PB Leiner | Combined capacity utilization following the Tessenderlo consolidation |
| PB Leiner | Gelatin, collagen peptides (SOLUGEL brand) | Integration progress under the combined Rousselot/PB Leiner structure |
| Roquette Frères | Plant-protein peptide fractionation | Pace of plant-based peptide share gains versus animal-based incumbents |
| ADM | Plant-derived protein hydrolysates at global scale | Scale advantage in a market where China's export pricing sets a low commodity floor |
| DSM-Firmenich | Branded, clinical-grade functional peptide ingredients | Premium positioning versus the commodity end of the pricing spread |
| Arla Foods Ingredients | Dairy/whey-derived functional peptides | Whey-derived peptide demand tied to sports nutrition segment growth |
| Nitta Gelatin | Japan-based collagen peptides, gelatin | Positioning within Japan's net-importer, higher-value-refining role |
Source: Navadhi Market Research, Global Food Peptide Market Strategic Research Report; UN Comtrade (HS 3504); company disclosures.
Analyst Insight
The most consequential fact in this report for competitive assessment isn't the $5.13 billion headline or the 7.8% CAGR - it's that a single HS trade code is hiding two genuinely different businesses at a nearly 17x price spread. Companies playing the commodity end of that range (bulk Chinese-style export production) and companies playing the premium end (Japan-style refined re-export, or branded functional-ingredient positioning from players like DSM-Firmenich) are not really competing head-to-head on the same axis, even though they show up in the same market-size figure. Anyone using this report to assess competitive positioning should read the trade-data pricing spread before the blended growth number - it explains far more about who's actually winning.
Strategic Lessons for Market Participants
| Observation | Strategic Implication |
|---|---|
| Implied export pricing under HS 3504 ranges from $2.50/kg to $42/kg across reporting countries | Treat "food peptide market" competitive analysis as at least two separate pricing tiers, not one blended category - commodity and premium players face different competitive dynamics entirely |
| China runs a ~$658M trade surplus; Japan runs a ~-$274M deficit in the same category | Regional demand and regional production capacity are not the same signal - a country can be a large "market" while being a net importer of finished ingredient value |
| Export growth leaders (Canada, South Korea, Brazil, all 18%+ CAGR) are not current size leaders | Track trade-flow growth rates, not just current market share, to identify where new capacity and trade relationships are actually forming |
| Animal-based sources hold just over half the market (50.7%), with plant/marine/microbial sources comprising the rest | Source diversification is already well underway - competitive strategy built solely around animal-derived supply chains is increasingly a minority-share position |
Frequently Asked Questions
What is the size of the global food peptide market?
The market reached an estimated USD 5.13 billion in 2025 and is projected to grow at a 7.8% CAGR to approximately USD 8.05 billion by 2031.
Which source segment is largest?
Animal-Based Peptides (dairy, fish, meat-derived) hold the largest share at approximately 50.7% (USD 2.60 billion) in 2025.
Does real trade data support the market-size estimate?
Yes. Real UN Comtrade data (HS code 3504) for 13 reporting countries shows combined 2024 export value of approximately $3.25 billion - roughly 63% of the full estimated global market - a plausibility check consistent with, not contradictory to, the reported market size.
Which countries are gaining export share fastest?
Canada (+20.8% CAGR, 2020-2024), South Korea (+19.8%) and Brazil (+18.8%) all posted export growth well above the category's blended value CAGR, suggesting these origins are gaining competitive share specifically.
Who are the key manufacturers?
Kerry Group, GELITA AG, Rousselot, PB Leiner, Roquette Frères, ADM, Cargill, Arla Foods Ingredients, Nitta Gelatin, DSM-Firmenich and Darling Ingredients are profiled in depth, covering both the commodity and premium ends of the market.
For full segment, application, regional and country-level detail - including complete UN Comtrade trade-flow analysis and all 11 company profiles - see our Global Food Peptide Market Strategic Research Report. For bespoke food-ingredient market analysis, commission custom research.