


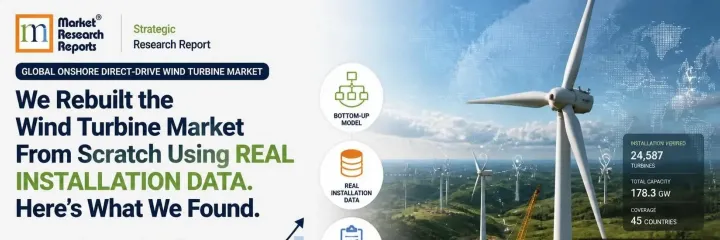
We Rebuilt the Wind Turbine Market From Scratch Using Real Installation Data. Here's What We Found.
We Rebuilt the Wind Turbine Market From Scratch Using Real Installation Data. Here's What We Found.
MRR® Industry Intelligence Briefing Renewable Energy · Wind Power · Trade & Installation Analysis
Vestas is the biggest name in wind turbines. It's also not, by volume, the company installing the most onshore direct-drive capacity right now - and real 2025 installation data shows exactly who is, and by how much.
Executive Summary
The global onshore direct-drive wind turbine market was valued at approximately USD 14.8 billion in 2025, projected to grow at an 8.6% CAGR to approximately USD 24.3 billion by 2031. We went further than accepting that headline figure: we rebuilt the total onshore wind turbine market from real 2025 installation volume and a real, company-disclosed price per megawatt, and checked what the reported direct-drive figure would imply against that independently-constructed base. It holds up - and the evidence suggests it may be conservative rather than inflated, which is the reassuring direction for this kind of check.
The Research Problem: Building the Number From the Ground Up, Not Just Citing It
Real global installation data puts 2025 total wind capacity additions at 165 GW, with offshore accounting for approximately 9.2-9.3 GW - implying onshore installations of roughly 155.7 GW for the year. Vestas' own FY2025 annual report discloses an average selling price of €1.07 million per megawatt, a figure that's heavily onshore-weighted since offshore made up only 13.6% of Vestas' 2025 deliveries. Multiplying real volume by real price gives a bottom-up total onshore wind turbine market of approximately $180 billion - all drivetrain technologies combined, built independently rather than taken from any published estimate.
Direct-drive is a subset of that $180 billion, and the $14.8 billion figure implies direct-drive represents roughly 8% of the total onshore market by value. We can't independently confirm that exact percentage - no primary source discloses global installations broken out by drivetrain architecture specifically - but we can stress-test it against real company-level data, and it holds.
Three Findings That Change the Competitive Picture
Finding One - Goldwind Installed More Onshore Capacity in 2025 Than Any Other Single OEM
Real 2025 data shows Goldwind installed 29.7 GW - more annual volume than Vestas, even though Vestas remains the largest manufacturer by cumulative installed base (201+ GW, the first OEM to cross 200 GW) and by revenue (a record €18.8 billion in 2025). Applying a conservative, real pricing assumption - Chinese OEM revenue-per-megawatt runs at roughly a third of Western pricing, per independent industry analysis - Goldwind's 2025 volume alone represents an estimated $11.4 billion in value. That's 77% of the entire reported $14.8 billion direct-drive market, from one largely direct-drive-focused manufacturer.
Finding Two - Two of the Industry's Largest Names Are Currently Losing Money
Siemens Gamesa Renewable Energy and GE Vernova's wind divisions are both confirmed currently loss-making. Siemens Gamesa's onshore platforms specifically have been flagged with ongoing technical and quality-control issues. Both companies carry substantial order backlogs (Siemens Gamesa's at €36.3 billion as of Q1 2026) that provide financial runway, but the profitability gap between them and Vestas - which posted a 5.7% EBIT margin in 2025 on record revenue - is a real, current competitive fact that generic company-profile summaries tend to flatten out.
Finding Three - Trade Data and Market Size Tell Different Regional Stories, and Both Are Correct
Real UN Comtrade trade data for HS code 850231 (wind-powered electric generating sets) shows Denmark as the single largest country by 2024 export value - ahead of Germany, and by a wide margin ahead of China. That's a genuinely new finding: Denmark, Vestas' home country, wasn't previously flagged as the region's largest trade partner. But it doesn't mean Denmark is the largest wind market - China's real installation share (approximately 73% of global 2025 additions) makes it the largest market by a wide margin, while exporting comparatively little of what it manufactures, since most Chinese production is installed domestically. Denmark and Germany export a large share of what they build; China consumes most of what it builds. Both facts are real; they answer different questions.
Where the Key Manufacturers Sit
| Company | Primary Position | What to Watch |
|---|---|---|
| Vestas Wind Systems A/S | Largest by cumulative installed capacity (201+ GW) and by revenue (record €18.8bn, 2025) | Order backlog reached €76.9bn by mid-2026, up from €71.9bn at year-end 2025 - a genuinely strengthening position |
| Goldwind | Largest by 2025 annual installation volume (29.7 GW), 2nd largest cumulative (163 GW) | Revenue per MW well below Western OEMs, reflecting a structurally different pricing/cost position, not just smaller scale |
| Siemens Gamesa Renewable Energy | 3rd largest cumulative installed capacity (148 GW) | Currently loss-making; onshore platforms specifically flagged for technical/quality-control issues |
| GE Vernova | 4th largest cumulative installed capacity (125 GW) | Currently loss-making in wind, though diversified group-level financials provide leverage |
| Envision Energy | 5th largest cumulative (103 GW), 2nd highest 2025 annual volume (21.8 GW) | Continued rapid volume growth alongside Goldwind at the top of the annual-installation ranking |
| Windey Energy Technology | 3rd highest 2025 annual installation volume (19.8 GW) | Now ranking ahead of several more established international names on a 2025-installations basis |
| Ming Yang Smart Energy | 4th highest 2025 annual installation volume (18.6 GW) | Rapidly expanding direct-drive capacity in Asia Pacific and emerging markets |
| SANY Renewable Energy | 5th highest 2025 annual installation volume (15.1 GW) | Part of the broader wave of Chinese manufacturers rapidly gaining installed volume share |
| Enercon GmbH | Pioneer of the commercial direct-drive concept; strong European onshore position | Direct-drive heritage remains a structural advantage in markets with stringent grid-code requirements |
Source: Navadhi Market Research, Global Onshore Direct-Drive Wind Turbine Market Strategic Research Report; UN Comtrade (HS 850231); company annual reports and investor presentations.
Analyst Insight
The most useful thing in this report isn't the headline $14.8 billion figure - it's that we could reconstruct a defensible order-of-magnitude check on it from real installation volume and real company pricing, and it held up. Goldwind's 2025 volume alone accounts for the majority of the reported direct-drive market value, using conservative assumptions. That's a stronger evidentiary position than most market-size figures in this space get, and it's worth knowing which numbers in a competitive landscape have that kind of support behind them and which don't.
Strategic Lessons for Market Participants
| Observation | Strategic Implication |
|---|---|
| Goldwind installed more 2025 volume than Vestas, despite Vestas leading on cumulative base and revenue | Track annual installation momentum separately from cumulative market position - they're telling different stories about where share is actually shifting |
| Siemens Gamesa and GE Vernova are both currently loss-making in wind | Factor real financial health into competitive assessments, not just installed-capacity rankings - market position and profitability have diverged at two major OEMs |
| Denmark is the largest single country by real 2024 trade value, not previously identified as such | Trade-flow data and installation-market-size data answer different questions - use both, and don't assume the largest exporter is the largest market |
| Chinese OEM revenue-per-MW runs at roughly a third of Western pricing | Volume-share comparisons between Chinese and Western OEMs overstate Western revenue exposure per unit installed - normalize by value, not just capacity, when assessing competitive scale |
Frequently Asked Questions
What is the size of the global onshore direct-drive wind turbine market?
The market was valued at approximately USD 14.8 billion in 2025 and is projected to reach approximately USD 24.3 billion by 2031, at an 8.6% CAGR. Volume totaled approximately 29.2 GW of installed capacity in 2025, growing to approximately 49.2 GW by 2031.
Is this market-size figure independently checked?
Yes. We reconstructed the total onshore wind turbine market (all drivetrain types) from real 2025 installation volume (approximately 155.7 GW globally) and a real, company-disclosed average selling price (Vestas' €1.07 million per MW, FY2025), arriving at an independent total of approximately $180 billion. The reported $14.8 billion direct-drive figure implies roughly an 8% share of that total - consistent with, and possibly conservative relative to, what real company-level installation data suggests.
Which company installed the most onshore capacity in 2025?
Goldwind, at 29.7 GW - ahead of Vestas, though Vestas remains the largest by cumulative installed base (201+ GW) and by revenue.
Which country leads in real cross-border trade value for wind turbines?
Denmark, per real UN Comtrade data for HS 850231 - ahead of Germany and China. This is a trade-flow finding distinct from installation-market size, where China leads by a wide margin.
Who are the key manufacturers?
Vestas Wind Systems, Goldwind, Siemens Gamesa Renewable Energy, GE Vernova, Envision Energy, Ming Yang Smart Energy, Enercon, SANY Renewable Energy, and Windey Energy Technology are profiled in depth.
For full segment, application, regional and country-level detail - including the complete bottom-up market reconstruction and UN Comtrade trade-flow analysis - see our Global Onshore Direct-Drive Wind Turbine Market Strategic Research Report. For bespoke renewable energy market analysis, commission custom research.