

Global Tire Market Strategic Research Report

By Type: Radial Tires, Bias Tires, Specialty Tires, Retreaded Tires
By Application: Passenger Cars, Light Commercial Vehicles, Trucks & Buses, Two-Wheelers, Agricultural Vehicles, Off-Highway & Construction
Regional Forecast: Asia Pacific, Latin America, MEA, Europe, North America
Key Players: Bridgestone Corporation, Compagnie Générale des Établissements Michelin, The Goodyear Tire and Rubber Company, Continental AG (Tires Group Sector), Sumitomo Rubber Industries, Ltd., The Yokohama Rubber Co., Ltd., Pirelli and C. S.p.A., Hankook Tire and Technology Co., Ltd., Sailun Group Co., Ltd., Linglong Tire Co., Ltd., CEAT Ltd., MRF Ltd. (Madras Rubber Factory), Cooper Tire and Rubber Company, Apollo Tyres Ltd., Maxxis International (Cheng Shin Rubber Ind. Co., Ltd.), Nexen Tire Corporation, Giti Tire Pte. Ltd., Toyo Tire Corporation, Zhongce Rubber Group Co., Ltd., Triangle Tyre Co., Ltd.
Übersicht
The global tire industry enters 2025-26 not merely in a growth phase, but in the midst of a profound structural transformation. Valued at a base-year figure of USD 222.1 billion, the market is projected to reach USD 288.1 billion by 2031, accelerating at a 4.4% CAGR. This represents a significant expansion in velocity compared to the 3.8% historical baseline, scaling to over 2.39 billion annual unit transactions today and reaching a cumulative volume of 2,813 million units by the end of the forecast horizon. While top-line metrics remain robust, value is migrating rapidly away from low-cost commodity replacement products. Profitability is concentrated within high-margin, technologically complex segments. Winners will be defined by their ability to navigate three simultaneous disruptions: the EV powertrain transition, a sustained premiumisation wave, and aggressive market-share expansion by Asian manufacturers threatening the historical dominance of Western incumbents. Global tire market is expected to be worth USD 288.1 billion by 2031.
Key Market Dynamics & Structural Tailwinds
The acceleration in market value over the forecast horizon is driven by three core structural catalysts. First, the rapid adoption of electric vehicles is fundamentally altering replacement cycles. EV architectures demand purpose-engineered tires featuring reinforced sidewalls, advanced compounds, and sound-absorbing technology. These specialized designs are required to manage higher vehicle weight, near-instantaneous torque, and unique wear patterns while lowering rolling resistance to extend range and enhancing cabin comfort. Consequently, this specialized EV segment is expanding at double-digit rates.
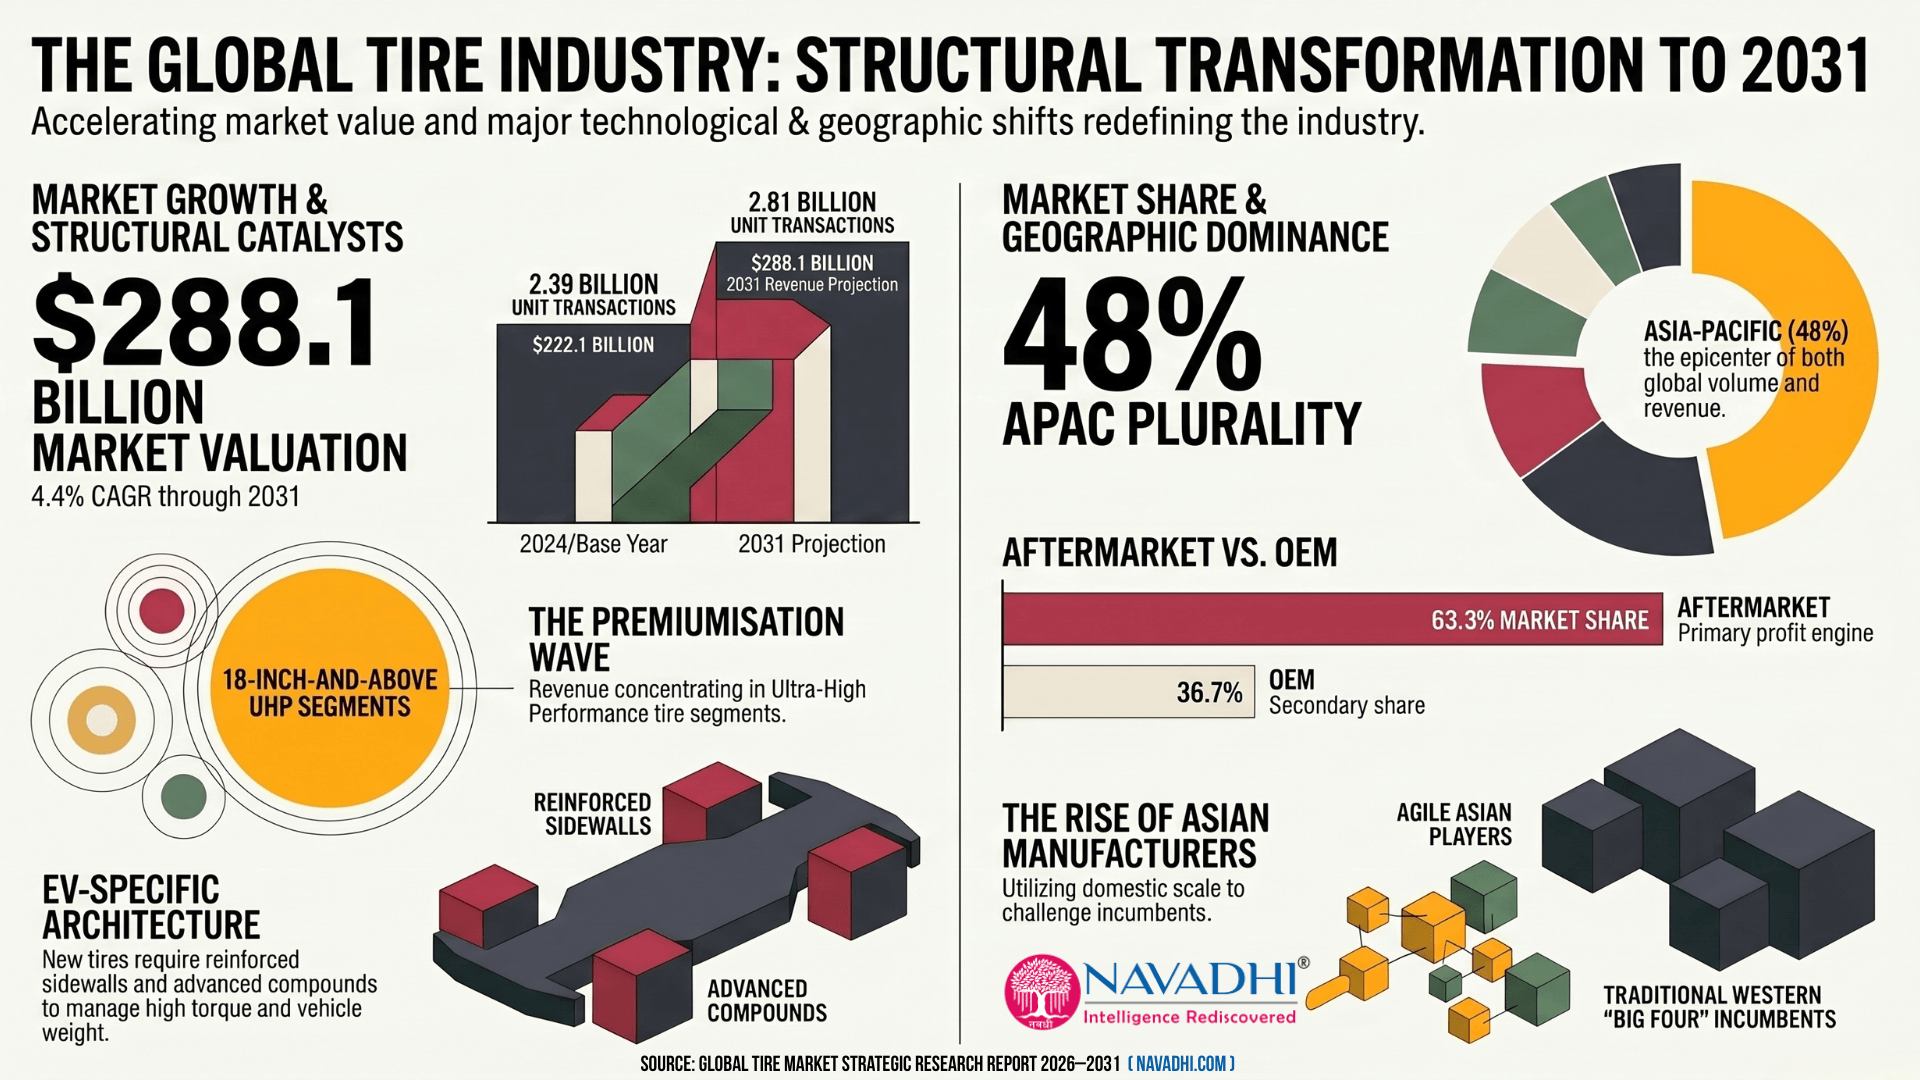
Second, a sustained premiumisation wave is reshaping consumer demand in mature markets like North America and Europe. Demographics are migrating sharply toward Ultra-High Performance (UHP), all-season, and run-flat tires, with revenue increasingly concentrated among players capable of delivering 18-inch-and-above fitments. Rising per capita income and urbanisation are driving this preference for advanced passenger-car tyres, thereby structurally diluting the volume-to-revenue leverage of low-cost commodity-replacement demand. Third, infrastructure-led commercial vehicle expansion across South and Southeast Asia is providing a powerful macroeconomic tailwind, sustaining long-term volume growth.
Segment & Channel Architecture
From a product and distribution perspective, the market operates as a distinct two-channel ecosystem divided between original equipment fitment (OEM) and the aftermarket, with radial technology serving as the bedrock across both. Radial tires secured the largest market share in 2024, favored for their durability, fuel efficiency, and versatile applications across passenger cars, commercial fleets, and electric vehicles.
In terms of value capture, the aftermarket segment remains the dominant revenue stream and the primary engine of industry profitability, commanding a 63.3% market share in 2024. This channel's expansion is driven by a rising global vehicle parc and the non-discretionary nature of tire replacement as road conditions and driving habits wear down equipment over time. Conversely, the OEM channel represents the remaining 36.7% of the market. While more cyclical and lower-margin, the OEM channel remains highly strategic for manufacturers looking to capture downstream aftermarket loyalty and anchor long-term brand equity.
Geographic Architecture: The Shift to APAC
Asia-Pacific has solidified its position as the unambiguous demand epicenter of the global tire ecosystem, capturing a dominant 48% plurality of both volume and revenue in 2024. This regional powerhouse is led by China, India, and Japan, which together command 72% of the total Asia-Pacific market. The rapid maturation of this region has fueled the market power of agile Asian manufacturers. Leveraging massive domestic scale and localized efficiencies, these players are posing an aggressive, direct structural threat to the historical market share, premium positioning, and pricing power of the traditional Western "Big Four" incumbents.
Strategic Implications for Leadership
To defend competitive positioning in this reshaped landscape, leadership must execute on three strategic imperatives. First, incumbents must aggressively protect and expand their 18-inch-and-above UHP footprints in mature economies to offset the margin compression occurring in commodity lines. Second, organizations must treat the EV tire segment as a distinct product architecture rather than a simple line extension, investing heavily in advanced compounding to lock in early OEM wins that secure high-value aftermarket replacement cycles. Finally, Western players must optimize their global supply chains and cost structures to counter the expanding international reach of Tier-1 and Tier-2 Asian manufacturers who are utilizing regional dominance to fund global expansion.
Scope of Global Tire Market Strategic Research Report 2026-2031
- This report provides forecast data by value (in USD billion) and volume (Mn Units) till 2031 for the global Tire market.
- This report provides segment by type (Radial Tires, Passenger Vehicle Radial, Commercial Vehicle Radial, Off-Highway Radial, Bias Tires, Agricultural Bias, Industrial Bias, Two-Wheeler Bias, Specialty Tires, Mining & Construction, Agricultural Specialty, Industrial Specialty, Retreaded Tires, Commercial Vehicle Retreaded, Passenger Vehicle Retreaded) forecast data by value (in USD billion) and volume (Mn Units) for the global Tire market till 2031.
- This report provides application segments (Passenger Cars, OEM, Replacement, Light Commercial Vehicles, Trucks & Buses, Two-Wheelers, Motorcycles, Scooters & Mopeds, Agricultural Vehicles, Tractors, Harvesting & Other Farm Equipment, Off-Highway & Construction, Construction Equipment, Mining Equipment) forecast data by value (in USD billion) and volume (Mn Units) for the global Tire market till 2031.
- This report provides region-wise (Asia-Pacific, North America, Europe, Middle East & Africa, Latin America) forecast data by value (in USD billion) and volume (Mn Units) for the global Tire market till 2031.
- This report also provides country-wise forecast data by value (in USD billion) and volume (Mn Units) for China, India, Japan, South Korea, Australia, Rest of Asia Pacific, USA, Canada, Mexico, Rest of North America, Germany, France, United Kingdom, Italy, Spain, Rest of Europe, Saudi Arabia, UAE, South Africa, Rest of Middle East & Africa, Brazil, Colombia, Rest of Latin America.
- This report identifies key growth drivers and inhibitors (pain points) affecting the global Tire market.
- This report provides SWOT (Strengths, Weaknesses, Opportunities and Threats) analysis, company profile including revenue (in USD billion), sale volume (Mn Units) and gross margin (%) for 2020-2025 along with competitive landscape for 20 key companies (Bridgestone Corporation, Compagnie Générale des Établissements Michelin, The Goodyear Tire & Rubber Company, Continental AG (Tires Group Sector), Sumitomo Rubber Industries, Ltd., The Yokohama Rubber Co., Ltd., Pirelli & C. S.p.A., Hankook Tire & Technology Co., Ltd., Sailun Group Co., Ltd., Linglong Tire Co., Ltd., CEAT Ltd., MRF Ltd. (Madras Rubber Factory), Cooper Tire & Rubber Company, Apollo Tyres Ltd., Maxxis International (Cheng Shin Rubber Ind. Co., Ltd.), Nexen Tire Corporation, Giti Tire Pte. Ltd., Toyo Tire Corporation, Zhongce Rubber Group Co., Ltd. and Triangle Tyre Co., Ltd.) in the global Tire market.
- This report provides Porter’s Five Forces analysis for the global Tire market.
- This report provides a PESTLE (political, economic, social, technological, legal, and environmental) analysis for the global Tire market.
- This report provides a SWOT (Strengths, Weaknesses, Opportunities, and Threats) analysis for the global Tire market.
- This report identifies key future trends in the global Tire market.
Segment by Type in the Global Tire Market
Radial Tires
- Passenger Vehicle Radial
- Commercial Vehicle Radial
- Off-Highway Radial
Bias Tires
- Agricultural Bias
- Industrial Bias
- Two-Wheeler Bias
Specialty Tires
- Mining & Construction
- Agricultural Specialty
- Industrial Specialty
Retreaded Tires
- Commercial Vehicle Retreaded
- Passenger Vehicle Retreaded
Segment by Application in the Global Tire Market
Passenger Cars
- OEM
- Replacement
Light Commercial Vehicles
- OEM
- Replacement
Trucks & Buses
- OEM
- Replacement
Two-Wheelers
- Motorcycles
- Scooters & Mopeds
Agricultural Vehicles
- Tractors
- Harvesting & Other Farm Equipment
Off-Highway & Construction
- Construction Equipment
- Mining Equipment
Segment by Region in the Global Tire Market
Asia-Pacific
- China
- India
- Japan
- South Korea
- Australia
- Rest of Asia Pacific
North America
- USA
- Canada
- Mexico
- Rest of North America
Europe
- Germany
- France
- United Kingdom
- Italy
- Spain
- Rest of Europe
Middle East & Africa
- Saudi Arabia
- UAE
- South Africa
- Rest of Middle East & Africa
Latin America
- Brazil
- Colombia
- Rest of Latin America
Who can use the Global Tire Market Research Report?
This research report is ideal for people who wish to gain a thorough understanding of the Tire market. Some of the intended users for this report are:
- C-level executives
- Company Directors
- Industry consultants
- Marketing professionals
- Business development professionals
- Management consultants
- Investment managers
- Financial professionals
- Venture Capitalists
- Bank Managers
- M&A Managers
- Auditors
- Anyone operating in Tire industry value chain.
Market snapshot
Global Tire Market Strategic Research Report snapshot, 2025–2031
 © MarketResearchReports.comDisclaimer: The actual data may vary in the final report which undergoes verification check post order confirmation.
Segments covered in this report
Table of contents
01Executive Summary
- 1.1 A USD 222 Billion Foundation Industry at an Inflection Point: Electrification, Premiumisation, and Asian Growth Redefine Competitive Logic Through 2031
- 1.1.1 Market Size and Historical Trajectory: USD 198.4 Bn to USD 222.1 Bn in Three Years
- 1.1.2 Forecast: USD 288.1 Billion by 2031 at 4.4% CAGR
- 1.1.3 Key Findings
- 1.1.4 Leading Companies: Competitive Hierarchy and Revenue Position
- 1.1.5 Regional Highlights: Asia-Pacific Commands the Volume Engine
- 1.1.6 Strategic Recommendations
02Industry Overview & Market Forecast
- 2.1 A USD 288 Billion Horizon: Structural Growth Engines Secure a 4.4% CAGR Through 2031
- 2.1.1 Historical & Forecast Market Sizing: Full Time-Series
- 2.1.2 CAGR Summary
- 2.1.3 Market Architecture and Structural Characteristics
- 2.1.4 Methodology and Data Derivation
- 2.1.5 Six Structural Growth Catalysts Driving the 2025–2031 Forecast
03Market Segmentation by Tire Type
- 3.1 Radial Tires Retain Structural Dominance; Specialty and Retreaded Segments Outpace the Market on a CAGR Basis
- 3.1.1 Market Segmentation by Type — Snapshot at 2025 Base Year
- 3.1.2 Full Time-Series by Segment Type (USD Bn), 2022–2031
- 3.1.3 Segment Deep Dive: Radial Tires — EV Tailwinds and Structural Leadership
- 3.1.3.1 Sub-Segment Breakdown: Radial Tires by Vehicle Class (2025E)
- 3.1.4 Segment Deep Dive: Bias Tires — Price Durability, Not Growth Durability
- 3.1.4.1 Sub-Segment Breakdown: Bias Tires by Application (2025E)
- 3.1.5 Segment Deep Dive: Specialty Tires — Infrastructure Super-Cycle Drives Highest CAGR
- 3.1.5.1 Sub-Segment Breakdown: Specialty Tires by End Application (2025E)
- 3.1.6 Segment Deep Dive: Retreaded Tires — Circular Economy Mandate Creates Structural Floor
- 3.1.6.1 Sub-Segment Breakdown: Retreaded Tires by Process / End-Use (2025E)
- 3.1.7 Comparative Segment Growth: Absolute Dollar Contribution vs. CAGR Matrix
04Market Segmentation by Application / Sales Channel
- 4.1 Passenger Vehicles Anchor Revenue, But Commercial & EV Segments Drive Incremental Growth Through 2031
- 4.1.1 Table 1: Global Tire Market by Application — Revenue Time Series (USD Bn, PMR Research Estimate)
- 4.1.2 Passenger Vehicles: Volume Leadership With Premiumisation Tailwind
- 4.1.3 Light Commercial Vehicles: E-Commerce Is the Dominant Structural Driver
- 4.1.4 Medium & Heavy Commercial Vehicles: Infrastructure Spend and Freight Recovery Support Steady Gains
- 4.1.5 Two- and Three-Wheelers: Emerging Market Volume Engine
- 4.1.6 Off-the-Road (OTR) and Specialty: Mining and Agriculture Provide Cyclical Uplift
- 4.1.7 Table 2: Application Segment Revenue Share and Implied CAGR Summary (PMR Research Estimate)
05Regional Market Forecast
- 5.1 Asia-Pacific Commands 48% of Global Revenue — and Will Deepen Its Lead Through 2031
- 5.2 Regional Market Size & Forecast Summary
- 5.3 North America: Mature Volume Base, But EV Premiumization and Infrastructure Spending Open Incremental Upside
- 5.4 Europe: Regulatory-Led Premiumization Offsets Structural Volume Stagnation
- 5.5 Middle East & Africa: Infrastructure Mega-Projects and Vision 2030 Unlock the Region's Fastest Per-Capita Growth Rate
- 5.6 Latin America: Brazil–Mexico Duopoly Drives 70% of Regional Volume, but Macroeconomic Volatility Remains the Ceiling
- 5.7 Regional Growth Convergence Analysis: The Strategic Polarisation Between Asia-Pacific and the Rest
06Country-Level Market Analysis & Forecast
- 6.1 Methodology and Data Framework
- 6.2 North America
- 6.2.1 United States
- 6.2.2 Canada
- 6.2.3 North America — Country Summary Table
- 6.3 Europe
- 6.3.1 Germany
- 6.3.2 France
- 6.3.3 United Kingdom
- 6.3.4 Italy
- 6.3.5 Spain
- 6.3.6 Europe — Country Summary Table
- 6.4 Asia-Pacific
- 6.4.1 China
- 6.4.2 India
- 6.4.3 Japan
- 6.4.4 South Korea
- 6.4.5 Australia
- 6.4.6 Asia-Pacific — Country Summary Table
- 6.5 Latin America
- 6.5.1 Brazil
- 6.5.2 Mexico
- 6.5.3 Colombia
- 6.5.4 Latin America — Country Summary Table
- 6.6 Middle East & Africa
- 6.6.1 Saudi Arabia (KSA)
- 6.6.2 United Arab Emirates (UAE)
- 6.6.3 South Africa
07Market Drivers, Restraints & Opportunities
- 7.1 Growth Drivers
- 7.2 Market Inhibitors / Challenges
- 7.3 Net Assessment
08Company Profiles
- 8.1 Bridgestone Corporation
- 8.1.1 Company Overview
- 8.1.2 Financial Performance (2022–2024)
- 8.1.3 Business Strategy
- 8.1.4 Product Strategy
- 8.1.5 SWOT Analysis
- 8.1.6 Strategic Implications (2025–2031)
- 8.2 Compagnie Générale des Établissements Michelin
- 8.2.1 Company Overview
- 8.2.2 Financial Performance (2022–2024)
- 8.2.3 Business Strategy
- 8.2.4 Product Strategy
- 8.2.5 SWOT Analysis
- 8.2.6 Strategic Implications (2025–2031)
- 8.3 The Goodyear Tire & Rubber Company
- 8.3.1 Company Overview
- 8.3.2 Financial Performance (2022–2024)
- 8.3.3 Business Strategy
- 8.3.4 Product Strategy
- 8.3.5 SWOT Analysis
- 8.3.6 Strategic Implications (2025–2031)
- 8.4 Continental AG (Tires Group Sector)
- 8.4.1 Company Overview
- 8.4.2 Financial Performance (2022–2024)
- 8.4.3 Business Strategy
- 8.4.4 Product Strategy
- 8.4.5 SWOT Analysis
- 8.4.6 Strategic Implications (2025–2031)
- 8.5 Sumitomo Rubber Industries, Ltd.
- 8.5.1 Company Overview
- 8.5.2 Financial Performance (2022–2024)
- 8.5.3 Business Strategy
- 8.5.4 Product Strategy
- 8.5.5 SWOT Analysis
- 8.5.6 Strategic Implications (2025–2031)
- 8.6 The Yokohama Rubber Co., Ltd.
- 8.6.1 Company Overview
- 8.6.2 Financial Performance (2020–2025)
- 8.6.3 Product Portfolio
- 8.6.4 Geographic Presence
- 8.6.5 Business Strategy (2023–2026 Priorities)
- 8.6.6 SWOT Analysis
- 8.6.7 Recent Developments (2023–2025)
- 8.7 Pirelli & C. S.p.A.
- 8.7.1 Company Overview
- 8.7.2 Financial Performance (2020–2025)
- 8.7.3 Product Portfolio
- 8.7.4 Geographic Presence
- 8.7.5 Business Strategy (2023–2026 Priorities)
- 8.7.6 SWOT Analysis
- 8.7.7 Recent Developments (2023–2025)
- 8.8 Hankook Tire & Technology Co., Ltd.
- 8.8.1 Company Overview
- 8.8.2 Financial Performance (2020–2025)
- 8.8.3 Product Portfolio
- 8.8.4 Geographic Presence
- 8.8.5 Business Strategy (2023–2026 Priorities)
- 8.8.6 SWOT Analysis
- 8.9 Sailun Group Co., Ltd.
- 8.9.1 Company Overview
- 8.9.2 Financial Performance (2020–2025)
- 8.9.3 Product Portfolio
- 8.9.4 Geographic Presence
- 8.9.5 Business Strategy (2023–2026)
- 8.9.6 SWOT Analysis
- 8.9.7 Recent Developments (2023–2025)
- 8.10 Linglong Tire Co., Ltd.
- 8.10.1 Company Overview
- 8.10.2 Financial Performance (2020–2025)
- 8.10.3 Product Portfolio
- 8.10.4 Geographic Presence
- 8.10.5 Business Strategy (2023–2026)
- 8.10.6 SWOT Analysis
- 8.10.7 Recent Developments (2023–2025)
- 8.11 CEAT Ltd.
- 8.11.1 Company Overview
- 8.11.2 Financial Performance (2020–2025)
- 8.11.3 Product Portfolio
- 8.11.4 Geographic Presence
- 8.11.5 Business Strategy (2023–2026)
- 8.11.6 SWOT Analysis
- 8.11.7 Recent Developments (2023–2025)
- 8.12 MRF Ltd. (Madras Rubber Factory)
- 8.12.1 Company Overview
- 8.12.2 Financial Performance (FY2020–FY2026)
- 8.12.3 Product Portfolio
- 8.12.3.1 Tire Categories & Revenue Mix (FY2024)
- 8.12.3.2 Flagship Brands & OEM Relationships
- 8.12.3.3 Technology Investments
- 8.12.4 Geographic Presence
- 8.12.4.1 India vs. Exports
- 8.12.4.2 Manufacturing Footprint
- 8.12.5 Business Strategy (FY2023–FY2026)
- 8.12.5.1 High-Intensity Capacity Expansion
- 8.12.5.2 EV Tyre Ecosystem Leadership
- 8.12.5.3 Export Revenue Scaling
- 8.12.5.4 Premiumisation & Brand Portfolio Deepening
- 8.12.5.5 Sustainability & Renewable Energy
- 8.12.6 SWOT Analysis
- 8.12.7 Recent Developments (FY2023–FY2026)
- 8.13 Cooper Tire & Rubber Company
- 8.13.1 Company Overview
- 8.13.2 Financial Performance (2020–2025)
- 8.13.3 Product Portfolio
- 8.13.4 Geographic Presence
- 8.13.5 Business Strategy (2023–2026)
- 8.13.6 SWOT Analysis
- 8.13.7 Recent Developments (2023–2025)
- 8.14 Apollo Tyres Ltd.
- 8.14.1 Company Overview
- 8.14.2 Financial Performance (2020–2025)
- 8.14.3 Product Portfolio
- 8.14.4 Geographic Presence
- 8.14.5 Business Strategy (2023–2026)
- 8.14.6 SWOT Analysis
- 8.14.7 Recent Developments (2023–2025)
- 8.15 Maxxis International (Cheng Shin Rubber Ind. Co., Ltd.)
- 8.15.1 Company Overview
- 8.15.2 Financial Performance (2020–2025)
- 8.15.3 Product Portfolio
- 8.15.4 Geographic Presence
- 8.15.5 Business Strategy (2023–2026)
- 8.15.6 SWOT Analysis
- 8.15.7 Recent Developments (2023–2025)
- 8.16 Nexen Tire Corporation
- 8.16.1 Company Overview
- 8.16.2 Financial Performance (2020–2025)
- 8.16.3 Product Portfolio
- 8.16.4 Geographic Presence
- 8.16.5 Business Strategy (2023–2026)
- 8.16.6 SWOT Analysis
- 8.16.7 Recent Developments (2023–2025)
- 8.17 Giti Tire Pte. Ltd.
- 8.17.1 Company Overview
- 8.17.2 Financial Performance (2020–2025)
- 8.17.3 Product Portfolio
- 8.17.4 Geographic Presence
- 8.17.5 Business Strategy (2023–2026)
- 8.17.6 SWOT Analysis
- 8.17.7 Recent Developments (2023–2025)
- 8.18 Toyo Tire Corporation
- 8.18.1 Company Overview
- 8.18.2 Financial Performance (2020–2025)
- 8.18.3 Product Portfolio
- 8.18.4 Geographic Presence
- 8.18.5 Business Strategy (2023–2026)
- 8.18.6 SWOT Analysis
- 8.18.7 Recent Developments (2023–2025)
- 8.19 Zhongce Rubber Group Co., Ltd.
- 8.19.1 Company Overview
- 8.19.2 Financial Performance (2020–2025)
- 8.19.3 Product Portfolio
- 8.19.4 Geographic Presence
- 8.19.5 Business Strategy (2023–2026)
- 8.19.6 SWOT Analysis
- 8.19.7 Recent Developments (2023–2025)
- 8.20 Triangle Tyre Co., Ltd.
- 8.20.1 Company Overview
- 8.20.2 Financial Performance (2020–2025)
- 8.20.3 Product Portfolio
- 8.20.4 Geographic Presence
- 8.20.5 Business Strategy (2023–2026)
- 8.20.6 SWOT Analysis
- 8.20.7 Recent Developments (2023–2025)
09Competitive Landscape
- 9.1 Structural Dominance Entrenches: Top Five Manufacturers Control an Estimated 58% of Global Tire Revenue in 2025
- 9.1.1 Competitive Market Share Estimates
- 9.1.2 Competitive Summary Scorecard — 2025
- 9.1.3 Competitive Dynamics: Pricing Pressure, Scale Barriers, and the China Variable
- 9.1.4 M&A Activity Summary — 2022–2025
- 9.1.5 Technology Differentiation Matrix — Key Players vs. Critical Innovation Axes
10Porter's Five Forces Analysis
- 10.1 Structural Barriers Entrench Incumbents: Porter's Five Forces Confirm a Moderately Attractive but Defensible Industry
- 10.1.1 Force 1: Threat of New Entrants — Low
- 10.1.2 Force 2: Supplier Power — Medium
- 10.1.3 Force 3: Buyer Power — Medium
- 10.1.4 Force 4: Threat of Substitutes — Low
- 10.1.5 Force 5: Competitive Rivalry — High
- 10.2 Porter's Five Forces Summary Table
- 10.3 Industry Attractiveness Assessment: Structurally Defensible, Cyclically Exposed
11PESTLE Analysis
- 11.1 Macro-Environment Shapes Competitive Posture: PESTLE Forces Redefine the Global Tire Industry Through 2031
- 11.2 Political: Trade Fragmentation and EV Policy Mandates Create Divergent Operating Conditions
- 11.3 Economic: Input Cost Normalization and Emerging Market Motorization Define the Revenue Envelope
- 11.4 Social: Urbanization, Safety Consciousness, and Sustainability Expectations Reshape Demand Quality
- 11.5 Technological: Electrification, Connectivity, and Materials Science Redefine the Product Roadmap
- 11.6 Legal: Labelling Mandates, Product Liability, and Antitrust Scrutiny Define Compliance Architecture
- 11.7 Environmental: Decarbonization Mandates and Circular Economy Frameworks Alter Cost and Material Structures
- 11.8 PESTLE Impact Summary
- 11.9 Macro-Environment Implications for Market Participants
12Industry SWOT Analysis
- 12.1 Structural Resilience Meets Structural Risk: A SWOT Assessment of the Global Tire Industry Through 2031
- 12.1.1 SWOT Matrix
- 12.1.1.1 Internal Factors
- 12.1.1.2 External Factors
- 12.1.2 SWOT Summary Matrix
- 12.1.3 Strategic Implications
- 12.1.4 Priority Actions for Market Participants Through 2031
13Future Trends & Innovation Outlook
- 13.1 Future Trends: Seven Structural Forces Redefining the Global Tire Industry Through 2031
- 13.1.1 Trend 1: EV-Optimized Tire Architecture Becomes a Competitive Necessity
- 13.1.2 Trend 2: Sustainable and Bio-Based Compound Innovation Transitions from Pilot to Scale
- 13.1.3 Trend 3: Intelligent Tire Technology and Embedded Sensor Integration Reaches Mass Market
- 13.1.4 Trend 4: Retreading and Circular Economy Models Capture Fleet Operator Cost Pressure
- 13.1.5 Trend 5: Asia-Pacific Manufacturing Shifts Drive Cost Structure Realignment
- 13.1.6 Trend 6: Autonomous and ADAS Vehicle Requirements Redefine Tire Performance Specifications
- 13.1.7 Trend 7: Tariff Escalation and Geopolitical Realignment Permanently Restructure Global Trade Flows
- 13.1.8 Trend 8: Subscription and Tire-as-a-Service (TaaS) Models Reshape Fleet Procurement Economics
- 13.2 Trend Impact Summary Table
- 13.3 Forward Outlook: 2025–2031 Market Trajectory Under Converging Structural Forces
- List of Exhibits
- Disclaimer, Methodology & Terms of Use
Tables and figures
List of Exhibits
- Exhibit 2.1: Forecast of Global (in USD Bn)
- Exhibit 2.2: Forecast of Asia Pacific (in USD Bn)
- Exhibit 2.3: Forecast of Europe (in USD Bn)
- Exhibit 2.4: Forecast of North America (in USD Bn)
- Exhibit 2.5: Forecast of Middle East & Africa (in USD Bn)
- Exhibit 2.6: Forecast of Latin America (in USD Bn)
- Exhibit 2.7: Forecast of Global (in Mn Units)
- Exhibit 2.8: Forecast of Asia Pacific (in Mn Units)
- Exhibit 2.9: Forecast of Europe (in Mn Units)
- Exhibit 2.10: Forecast of North America (in Mn Units)
- Exhibit 2.11: Forecast of Middle East & Africa (in Mn Units)
- Exhibit 2.12: Forecast of Latin America (in Mn Units)
- Exhibit 3.13: Forecast of Radial Tires (in USD Bn)
- Exhibit 3.14: Forecast of Passenger Vehicle Radial (in USD Bn)
- Exhibit 3.15: Forecast of Commercial Vehicle Radial (in USD Bn)
- Exhibit 3.16: Forecast of Off-Highway Radial (in USD Bn)
- Exhibit 3.17: Forecast of Specialty Tires (in USD Bn)
- Exhibit 3.18: Forecast of Mining & Construction (in USD Bn)
- Exhibit 3.19: Forecast of Agricultural Specialty (in USD Bn)
- Exhibit 3.20: Forecast of Industrial Specialty (in USD Bn)
- Exhibit 3.21: Forecast of Retreaded Tires (in USD Bn)
- Exhibit 3.22: Forecast of Commercial Vehicle Retreaded (in USD Bn)
- Exhibit 3.23: Forecast of Passenger Vehicle Retreaded (in USD Bn)
- Exhibit 3.24: Forecast of Radial Tires (in Mn Units)
- Exhibit 3.25: Forecast of Passenger Vehicle Radial (in Mn Units)
- Exhibit 3.26: Forecast of Commercial Vehicle Radial (in Mn Units)
- Exhibit 3.27: Forecast of Off-Highway Radial (in Mn Units)
- Exhibit 3.28: Forecast of Specialty Tires (in Mn Units)
- Exhibit 3.29: Forecast of Mining & Construction (in Mn Units)
- Exhibit 3.30: Forecast of Agricultural Specialty (in Mn Units)
- Exhibit 3.31: Forecast of Industrial Specialty (in Mn Units)
- Exhibit 3.32: Forecast of Retreaded Tires (in Mn Units)
- Exhibit 3.33: Forecast of Commercial Vehicle Retreaded (in Mn Units)
- Exhibit 3.34: Forecast of Passenger Vehicle Retreaded (in Mn Units)
- Exhibit 3.35: Forecast of Bias Tires (in USD Bn)
- Exhibit 3.36: Forecast of Agricultural Bias (in USD Bn)
- Exhibit 3.37: Forecast of Industrial Bias (in USD Bn)
- Exhibit 3.38: Forecast of Two-Wheeler Bias (in USD Bn)
- Exhibit 3.39: Forecast of Bias Tires (in Mn Units)
- Exhibit 3.40: Forecast of Agricultural Bias (in Mn Units)
- Exhibit 3.41: Forecast of Industrial Bias (in Mn Units)
- Exhibit 3.42: Forecast of Two-Wheeler Bias (in Mn Units)
- Exhibit 4.43: Forecast of Light Commercial Vehicles (in USD Bn)
- Exhibit 4.44: Forecast of OEM (in USD Bn)
- Exhibit 4.45: Forecast of Replacement (in USD Bn)
- Exhibit 4.46: Forecast of Light Commercial Vehicles (in Mn Units)
- Exhibit 4.47: Forecast of OEM (in Mn Units)
- Exhibit 4.48: Forecast of Replacement (in Mn Units)
- Exhibit 4.49: Forecast of Two-Wheelers (in USD Bn)
- Exhibit 4.50: Forecast of Motorcycles (in USD Bn)
- Exhibit 4.51: Forecast of Scooters & Mopeds (in USD Bn)
- Exhibit 4.52: Forecast of Two-Wheelers (in Mn Units)
- Exhibit 4.53: Forecast of Motorcycles (in Mn Units)
- Exhibit 4.54: Forecast of Scooters & Mopeds (in Mn Units)
- Exhibit 4.55: Forecast of Passenger Cars (in USD Bn)
- Exhibit 4.56: Forecast of OEM (in USD Bn)
- Exhibit 4.57: Forecast of Replacement (in USD Bn)
- Exhibit 4.58: Forecast of Trucks & Buses (in USD Bn)
- Exhibit 4.59: Forecast of OEM (in USD Bn)
- Exhibit 4.60: Forecast of Replacement (in USD Bn)
- Exhibit 4.61: Forecast of Agricultural Vehicles (in USD Bn)
- Exhibit 4.62: Forecast of Tractors (in USD Bn)
- Exhibit 4.63: Forecast of Harvesting & Other Farm Equipment (in USD Bn)
- Exhibit 4.64: Forecast of Off-Highway & Construction (in USD Bn)
- Exhibit 4.65: Forecast of Construction Equipment (in USD Bn)
- Exhibit 4.66: Forecast of Mining Equipment (in USD Bn)
- Exhibit 4.67: Forecast of Passenger Cars (in Mn Units)
- Exhibit 4.68: Forecast of OEM (in Mn Units)
- Exhibit 4.69: Forecast of Replacement (in Mn Units)
- Exhibit 4.70: Forecast of Trucks & Buses (in Mn Units)
- Exhibit 4.71: Forecast of OEM (in Mn Units)
- Exhibit 4.72: Forecast of Replacement (in Mn Units)
- Exhibit 4.73: Forecast of Agricultural Vehicles (in Mn Units)
- Exhibit 4.74: Forecast of Tractors (in Mn Units)
- Exhibit 4.75: Forecast of Harvesting & Other Farm Equipment (in Mn Units)
- Exhibit 4.76: Forecast of Off-Highway & Construction (in Mn Units)
- Exhibit 4.77: Forecast of Construction Equipment (in Mn Units)
- Exhibit 4.78: Forecast of Mining Equipment (in Mn Units)
- Exhibit 5.79: Forecast of Asia Pacific (in USD Bn)
- Exhibit 5.80: Forecast of China (in USD Bn)
- Exhibit 5.81: Forecast of India (in USD Bn)
- Exhibit 5.82: Forecast of Japan (in USD Bn)
- Exhibit 5.83: Forecast of South Korea (in USD Bn)
- Exhibit 5.84: Forecast of Australia (in USD Bn)
- Exhibit 5.85: Forecast of Rest of Asia Pacific (in USD Bn)
- Exhibit 5.86: Forecast of Asia Pacific (in Mn Units)
- Exhibit 5.87: Forecast of China (in Mn Units)
- Exhibit 5.88: Forecast of India (in Mn Units)
- Exhibit 5.89: Forecast of Japan (in Mn Units)
- Exhibit 5.90: Forecast of South Korea (in Mn Units)
- Exhibit 5.91: Forecast of Australia (in Mn Units)
- Exhibit 5.92: Forecast of Rest of Asia Pacific (in Mn Units)
- Exhibit 5.93: Forecast of North America (in USD Bn)
- Exhibit 5.94: Forecast of USA (in USD Bn)
- Exhibit 5.95: Forecast of Canada (in USD Bn)
- Exhibit 5.96: Forecast of Mexico (in USD Bn)
- Exhibit 5.97: Forecast of Rest of North America (in USD Bn)
- Exhibit 5.98: Forecast of North America (in Mn Units)
- Exhibit 5.99: Forecast of USA (in Mn Units)
- Exhibit 5.100: Forecast of Canada (in Mn Units)
- Exhibit 5.101: Forecast of Mexico (in Mn Units)
- Exhibit 5.102: Forecast of Rest of North America (in Mn Units)
- Exhibit 5.103: Forecast of Middle East & Africa (in USD Bn)
- Exhibit 5.104: Forecast of Saudi Arabia (in USD Bn)
- Exhibit 5.105: Forecast of UAE (in USD Bn)
- Exhibit 5.106: Forecast of South Africa (in USD Bn)
- Exhibit 5.107: Forecast of Rest of Middle East & Africa (in USD Bn)
- Exhibit 5.108: Forecast of Middle East & Africa (in Mn Units)
- Exhibit 5.109: Forecast of Saudi Arabia (in Mn Units)
- Exhibit 5.110: Forecast of UAE (in Mn Units)
- Exhibit 5.111: Forecast of South Africa (in Mn Units)
- Exhibit 5.112: Forecast of Rest of Middle East & Africa (in Mn Units)
- Exhibit 5.113: Forecast of Latin America (in USD Bn)
- Exhibit 5.114: Forecast of Brazil (in USD Bn)
- Exhibit 5.115: Forecast of Colombia (in USD Bn)
- Exhibit 5.116: Forecast of Rest of Latin America (in USD Bn)
- Exhibit 5.117: Forecast of Latin America (in Mn Units)
- Exhibit 5.118: Forecast of Brazil (in Mn Units)
- Exhibit 5.119: Forecast of Colombia (in Mn Units)
- Exhibit 5.120: Forecast of Rest of Latin America (in Mn Units)
- Exhibit 5.121: Forecast of Europe (in USD Bn)
- Exhibit 5.122: Forecast of Germany (in USD Bn)
- Exhibit 5.123: Forecast of France (in USD Bn)
- Exhibit 5.124: Forecast of United Kingdom (in USD Bn)
- Exhibit 5.125: Forecast of Italy (in USD Bn)
- Exhibit 5.126: Forecast of Spain (in USD Bn)
- Exhibit 5.127: Forecast of Rest of Europe (in USD Bn)
- Exhibit 5.128: Forecast of Europe (in Mn Units)
- Exhibit 5.129: Forecast of Germany (in Mn Units)
- Exhibit 5.130: Forecast of France (in Mn Units)
- Exhibit 5.131: Forecast of United Kingdom (in Mn Units)
- Exhibit 5.132: Forecast of Italy (in Mn Units)
- Exhibit 5.133: Forecast of Spain (in Mn Units)
- Exhibit 5.134: Forecast of Rest of Europe (in Mn Units)
Frequently asked questions
What is the projected value and growth rate of the global tire market by 2031?
What are the primary structural catalysts driving the growth of the tire market?
How is the global tire market segmented between aftermarket and OEM channels?
Which region currently leads the global tire market?
What strategic imperatives are recommended for leadership to remain competitive?
What does the research report cover in terms of market analysis?
Research Methodology
All MarketResearchReports.com strategic research reports follow a rigorous, multi-stage methodology combining AI-assisted data synthesis with expert analyst validation.
Systematic collection from 500+ verified sources including SEC filings, industry databases (Bloomberg, Statista, OECD), regulatory filings, trade publications, patent databases, and company annual reports. AI-assisted extraction identifies relevant data points across 10,000+ documents per report.
Dual-validation approach: bottom-up sizing aggregates segment-level production, consumption, and trade data; top-down sizing cross-validates against macroeconomic indicators and total addressable market estimates. Discrepancies >5% trigger analyst review.
Company profiles built from public financial disclosures, product launches, M&A activity, job postings (as capability proxies), and supply chain mapping. Market share estimates triangulated across revenue, capacity, and shipment data.
CAGR projections use time-series regression on 5-10 years of historical data, adjusted for identified demand drivers (technology adoption curves, regulatory catalysts, demographic shifts) and demand inhibitors (cost barriers, substitution risk). Scenario modeling covers base, optimistic, and conservative cases.
All quantitative outputs reviewed by a domain-specialist analyst before publication. Data triangulation requires minimum 3 independent sources for every key figure. Reports undergo a structured peer review against our 47-point quality checklist covering methodology, data citations, logical consistency, and formatting standards.
On-demand reports are generated at time of purchase, incorporating the most recent available data. Static reports are republished when underlying market conditions shift by >10% from baseline assumptions. Purchasers receive update notifications for 12 months.
Related reports
 Navadhi Market Research · Automotive & Mobility
Global High-Performance Threads for Automotive Airbags and Seatbelt Systems Market Strategic Research Report
The global market for high-performance threads used in automotive-industry-strategic-research-report" title="Global Automotive Industry Strategic Research Report">…
Navadhi Market Research · Automotive & MobilityGlobal EV Thermal Management Fluid Market Strategic Research Report
The global EV thermal management fluid market occupies a critical position at the intersection of electric vehicle adoption and advanced materials science. As batter…
Navadhi Market Research · Automotive & MobilityGlobal Automotive Zone Control Unit (ZCU) Market Strategic Research Report
The global automotive Industry Strategic Research Report">global automotive Zone Control Unit (ZCU) market occupies a pivotal position in the ongoing transformati…
Need a customized version?
Get country-, segment- or company-specific intelligence tailored to your exact requirements.
Request custom research →Request a free sample
Receive a sample of Global Tire Market Strategic Research Report before you buy.
Customize This Report
Describe your specific requirements and our analysts will scope and deliver a tailored version.
Request Invoice
We will email a proforma invoice within 24 hours. Report access is granted upon payment confirmation.
Leading Brands in This Industry



