

Global Medical Devices Industry Strategic Research Report
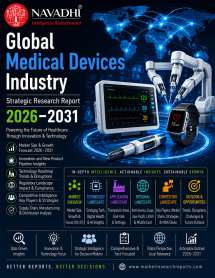
By Type: In Vitro Diagnostics, Cardiovascular Devices, Diagnostic Imaging, Surgical and Minimally Invasive/Robotic Devices, Patient Monitoring and Diabetes Care, Orthopedic Devices, Ophthalmic Devices
By Application: Hospitals, Diagnostic and Imaging Centers, Ambulatory Surgical Centers, Home Healthcare, Clinics and Physician Offices
Regional Forecast: Asia Pacific, Latin America, MEA, Europe, North America
Key Players: Medtronic, Johnson &, Johnson MedTech, Abbott Laboratories (Medical Devices), Medline Industries, Siemens Healthineers, Stryker Corporation, Becton Dickinson (BD), GE HealthCare, Philips (Health Systems), Boston Scientific, Roche Diagnostics, Baxter International, Cardinal Health (Medical Segment), Danaher (Diagnostics/Life Sciences), Zimmer Biomet, Intuitive Surgical, Terumo Corporation, Olympus Corporation, Smith+Nephew, Edwards Lifesciences, Dexcom, Hologic, Insulet Corporation, Alcon, ResMed
개요
The global medical devices market reached $581.1 billion in 2025, derived as the average of four independently published market research estimates that converge tightly within a $572-586 billion range, a notably tighter convergence than found for the companion Healthcare-industry-strategic-research-report" title="Global Healthcare Industry Strategic Research Report">healthcare Industry report, reflecting medical devices being a more consistently-scoped market category across research firms. This report defines the medical devices industry as diagnostic and therapeutic device manufacturing -- cardiovascular, orthopedic, diagnostic imaging, in-vitro diagnostics, surgical/robotic, patient monitoring, ophthalmic, and dental categories -- deliberately excluding pharmaceutical manufacturing and healthcare services/delivery, which are covered as separate Navadhi mother reports. The market is forecast to grow from $581.1 billion in 2025 to $825.5 billion by 2031, a compound annual growth rate of approximately 6.0%, with growth rates gently accelerating year over year -- from 4.8% in 2026 to 6.7% in 2031 -- reflecting the compounding effect of structural demand drivers rather than any single-period event-driven surge.
M&A activity across the tracked player universe has been concentrated in two strategic themes: expanding surgical robotics capabilities and reinforcing connected-care platforms. Medtronic has continued to invest in its Hugo robotic-assisted surgery platform, targeting direct competition with Intuitive Surgical's da Vinci ecosystem, while simultaneously rationalizing its portfolio through selective divestitures, including the Patient Monitoring and Respiratory Interventions business separation completed in 2024. Stryker's Mako robotic orthopedic platform remains a core M&A-integration anchor, with the company pursuing bolt-on deals in neurosurgery and endoscopy to diversify beyond its core orthopedics franchise. Boston Scientific's exceptional 20.3% FY2025 growth has been materially supported by its acquisition strategy in electrophysiology and structural heart, while Insulet and Dexcom have deepened interoperability agreements with major consumer technology platforms, reflecting the industry's accelerating shift toward closed-loop, home-managed diabetes care systems.
Scope of Global Medical Devices Industry Strategic Research Report 2026-2031
- This report provides forecast data by value for the global medical devices industry, with 2025 as the base year and forecasting to 2031.
- This report provides segmentation by type (In Vitro Diagnostics, Cardiovascular Devices, Diagnostic Imaging, Surgical and Minimally Invasive/Robotic Devices, Patient Monitoring and Diabetes Care, Orthopedic Devices, Ophthalmic Devices) and by end-use setting (Hospitals, Diagnostic and Imaging Centers, Ambulatory Surgical Centers, Home Healthcare, Clinics and Physician Offices).
- This report provides region-wise and country-level forecast data across 5 regions and 16 countries.
- This report identifies key growth drivers and inhibitors, including population aging, rising chronic disease prevalence, and the accelerating commercial penetration of surgical robotics and connected diabetes care technologies.
- This report provides company profiles for the 25 leading medical device companies, each covering Company Overview, Key Products & Segments, Financial Performance, Business Strategy, SWOT Analysis, and Strategic Implications.
- This report provides Porter's Five Forces, PESTLE, and SWOT analysis.
- This report identifies key future trends through 2031.
Segment by Type
- In Vitro Diagnostics
- Cardiovascular Devices
- Diagnostic Imaging
- Surgical and Minimally Invasive/Robotic Devices
- Patient Monitoring and Diabetes Care
- Orthopedic Devices
- Ophthalmic Devices
Segment by Application
- Hospitals
- Diagnostic and Imaging Centers
- Ambulatory Surgical Centers
- Home Healthcare
- Clinics and Physician Offices
Segment by Region
- North America (United States, Canada, Rest of North America)
- Europe (Germany, France, United Kingdom, Italy, Rest of Europe)
- Asia-Pacific (China, Japan, South Korea, India, Australia, Rest of Asia Pacific)
- Latin America (Brazil, Mexico, Rest of Latin America)
- Middle East & Africa (Saudi Arabia, UAE, South Africa, Rest of Middle East and Africa)
Who Can Use the Global Medical Devices Industry Strategic Research Report?
This research report is ideal for people who wish to gain a thorough understanding of the medical devices market. Some of the intended users are:
- C-level executives and Company Directors in medical device manufacturing and distribution companies
- Investment managers, Financial professionals, and Healthcare/MedTech sector equity analysts
- Regulatory affairs and market access professionals tracking FDA, CE marking, and reimbursement policy
- Hospital and healthcare system procurement executives evaluating device technology and vendors
- Anyone operating in the global medical devices value chain
Market snapshot
Global Medical Devices Industry Strategic Research Report snapshot, 2025–2031
 © MarketResearchReports.comDisclaimer: The actual data may vary in the final report which undergoes verification check post order confirmation.
Segments covered in this report
Table of contents
01Executive Summary
- 1.1 Market Synopsis
- 1.2 Key Findings
- 1.3 Strategic Recommendations
02Industry Overview & Forecast
- 2.1 Market Definition & Scope
- 2.2 Market Value Forecast
- 2.2.1 Base-Year Establishment & Methodological Confidence
- 2.2.2 Global Market Forecast, 2025–2031
- 2.2.3 Vendor-Tier Market Structure
- 2.3 Historical Market Review
- 2.3.1 Growth Through the Historic Period, 2022–2024
- 2.4 Market Segmentation by Device Type
- 2.4.1 Segmentation Overview & Structural Dynamics
- 2.4.2 In Vitro Diagnostics — The Largest Category by Value
- 2.4.3 Cardiovascular Devices — The Largest Category by Several Metrics
- 2.4.4 Diagnostic Imaging — A Large but Gradually Declining Share Category
- 2.4.5 Surgical & Minimally Invasive/Robotic Devices — The Fastest-Growing Category
- 2.4.6 Patient Monitoring & Diabetes Care — A Rising-Share Category
- 2.4.7 Orthopedic Devices — A Stable, Mature Category
- 2.4.8 Ophthalmic Devices — A Smaller but Stable Growth Category
- 2.5 Market Segmentation by End-Use Setting
- 2.5.1 The Structural Migration Away From Hospital-Centric Device Demand
- 2.5.2 Ambulatory Surgical Centres — The Fastest-Growing Setting
- 2.5.3 Home Healthcare — The Highest Share-Gain Setting
- 2.5.4 Diagnostic & Imaging Centres and Clinics — Stable Positioning
- 2.6 Regional Market Forecast
- 2.6.1 Regional Overview
- 2.6.2 North America — The Dominant Region
- 2.6.3 Asia-Pacific — The Fastest-Growing Region
- 2.6.4 Europe — The Third-Largest Region
- 2.6.5 Latin America — A Smaller but Growing Market
- 2.6.6 Middle East & Africa — The Smallest but Developing Region
- 2.7 Key Forecast Takeaways
03Market Segmentation by Type
- 3.1 Segmentation Overview and Structural Framework
- 3.2 In Vitro Diagnostics — The Largest Category by Share Methodology
- 3.3 Cardiovascular Devices — The Largest Category by Absolute Value
- 3.4 Diagnostic Imaging — A Large Category With Declining Relative Share
- 3.5 Surgical and Minimally Invasive/Robotic Devices — The Fastest-Growing Category
- 3.6 Patient Monitoring and Diabetes Care — Rising Share Driven by Connected Devices
- 3.7 Orthopedic Devices — Stable Category With Steady Structural Demand
- 3.8 Ophthalmic Devices — Stable Niche With Consistent Growth
- 3.9 Dental and Wound Care Devices — Residual Category
- 3.10 Cross-Category Growth Rate Comparison and Strategic Implications
04Market Segmentation by Application
- 4.1 Overview: End-Use Setting as the Analytical Framework
- 4.2 Hospitals: Dominant but Gradually Declining Share
- 4.3 Diagnostic and Imaging Centers: Stable and Proportionate Growth
- 4.4 Ambulatory Surgical Centers: The Fastest-Gaining Setting by Share
- 4.5 Home Healthcare: Rising Share Driven by Connected Device Adoption
- 4.6 Clinics and Physician Offices: Small but Structurally Stable
- 4.7 Research and Academic Institutes: A Residual and Declining Share
- 4.8 Structural Summary: The Shift Away from Hospital-Centric Demand
05Regional Market Forecast
- North America
- Europe
- Asia-Pacific
- Latin America
- Middle East & Africa
06Country-Level Market Forecast
- 6.1 North America
- 6.1.1 United States
- 6.1.2 Canada
- 6.1.3 Rest of North America
- 6.2 Europe
- 6.2.1 Germany
- 6.2.2 France
- 6.2.3 United Kingdom
- 6.2.4 Italy
- 6.2.5 Rest of Europe
- 6.3 Asia-Pacific
- 6.3.1 China
- 6.3.2 Japan
- 6.3.3 South Korea
- 6.3.4 India
- 6.3.5 Australia
- 6.3.6 Rest of Asia Pacific
- 6.4 Latin America
- 6.4.1 Brazil
- 6.4.2 Mexico
- 6.4.3 Rest of Latin America
- 6.5 Middle East & Africa
- 6.5.1 Saudi Arabia
- 6.5.2 UAE
- 6.5.3 South Africa
- 6.5.4 Rest of Middle East and Africa
07Growth Drivers & Inhibitors
- 7.1 Structural Growth Drivers
- 7.1.1 Chronic and Acute Disease Burden
- 7.1.2 Minimally Invasive and Robotic Surgical Technology Adoption
- 7.1.3 Connected Health and Home-Based Monitoring Convergence
- 7.1.4 Technological Innovation and AI-Augmented Device Intelligence
- 7.2 Market Restraints and Inhibitors
- 7.2.1 Regulatory Complexity and Commercialisation Timeline Risk
- 7.2.2 Reimbursement Policy Exposure
- 7.2.3 Market Fragmentation and Pricing Dynamics
- 7.2.4 Supply Chain Concentration and Input Cost Volatility
- 7.3 Opportunities and White-Space Analysis
- 7.3.1 Surgical Robotics Platform Expansion
- 7.3.2 Connected and Ambulatory Monitoring Ecosystems
- 7.3.3 Emerging Market Infrastructure Development
- 7.3.4 Stable Category Operational Execution Opportunity
08Key Company Profiles (Medtronic, Johnson & Johnson MedTech, Abbott Laboratories (Medical Devices), Medline Industries, Siemens Healthineers, Stryker Corporation, Becton Dickinson (BD), GE HealthCare, Philips (Health Systems), Boston Scientific, Roche Diagnostics, Baxter International, Cardinal Health (Medical Segment), Danaher (Diagnostics/Life Sciences), Zimmer Biomet, Intuitive Surgical, Terumo Corporation, Olympus Corporation, Smith+Nephew, Edwards Lifesciences, Dexcom, Hologic, Insulet Corporation, Alcon, ResMed)
- 8.1 Medtronic
- 8.1.1 Company Overview
- 8.1.2 Key Products & Segments
- 8.1.3 Financial Performance (2023–2025)
- 8.1.4 Business Strategy
- 8.1.5 SWOT Analysis
- 8.1.6 Strategic Implications (2025–2031)
- 8.2 Johnson & Johnson MedTech
- 8.2.1 Company Overview
- 8.2.2 Key Products & Segments
- 8.2.3 Financial Performance (2023–2025)
- 8.2.4 Business Strategy
- 8.2.5 SWOT Analysis
- 8.2.6 Strategic Implications (2025–2031)
- 8.3 Abbott Laboratories (Medical Devices)
- 8.3.1 Company Overview
- 8.3.2 Key Products & Segments
- 8.3.3 Financial Performance (2023–2025)
- 8.3.4 Business Strategy
- 8.3.5 SWOT Analysis
- 8.3.6 Strategic Implications (2025–2031)
- 8.4 Medline Industries
- 8.4.1 Company Overview
- 8.4.2 Key Products & Segments
- 8.4.3 Financial Performance (2023–2025)
- 8.4.4 Business Strategy
- 8.4.5 SWOT Analysis
- 8.4.6 Strategic Implications (2025–2031)
- 8.5 Siemens Healthineers
- 8.5.1 Company Overview
- 8.5.2 Key Products & Segments
- 8.5.3 Financial Performance (2023–2025)
- 8.5.4 Business Strategy
- 8.5.5 SWOT Analysis
- 8.5.6 Strategic Implications (2025–2031)
- 8.6 Stryker Corporation
- 8.6.1 Company Overview
- 8.6.2 Key Products & Segments
- 8.6.3 Financial Performance (2023–2025)
- 8.6.4 Business Strategy
- 8.6.5 SWOT Analysis
- 8.6.6 Strategic Implications (2025–2031)
- 8.7 Becton Dickinson (BD)
- 8.7.1 Company Overview
- 8.7.2 Key Products & Segments
- 8.7.3 Financial Performance (2023–2025)
- 8.7.4 Business Strategy
- 8.7.5 SWOT Analysis
- 8.7.6 Strategic Implications (2025–2031)
- 8.8 GE HealthCare
- 8.8.1 Company Overview
- 8.8.2 Key Products & Segments
- 8.8.3 Financial Performance (2023–2025)
- 8.8.4 Business Strategy
- 8.8.5 SWOT Analysis
- 8.8.6 Strategic Implications (2025–2031)
- 8.9 Philips (Health Systems)
- 8.9.1 Company Overview
- 8.9.2 Key Products & Segments
- 8.9.3 Financial Performance (2023–2025)
- 8.9.4 Business Strategy
- 8.9.5 SWOT Analysis
- 8.9.6 Strategic Implications (2025–2031)
- 8.10 Boston Scientific
- 8.10.1 Company Overview
- 8.10.2 Key Products & Segments
- 8.10.3 Financial Performance (2023–2025)
- 8.10.4 Business Strategy
- 8.10.5 SWOT Analysis
- 8.10.6 Strategic Implications (2025–2031)
- 8.11 Roche Diagnostics
- 8.11.1 Company Overview
- 8.11.2 Key Products & Segments
- 8.11.3 Financial Performance (2023–2025)
- 8.11.4 Business Strategy
- 8.11.5 SWOT Analysis
- 8.11.6 Strategic Implications (2025–2031)
- 8.12 Baxter International
- 8.12.1 Company Overview
- 8.12.2 Key Products & Segments
- 8.12.3 Financial Performance (2023–2025)
- 8.12.4 Business Strategy
- 8.12.5 SWOT Analysis
- 8.12.6 Strategic Implications (2025–2031)
- 8.13 Cardinal Health (Medical Segment)
- 8.13.1 Company Overview
- 8.13.2 Key Products & Segments
- 8.13.3 Financial Performance (2023–2025)
- 8.13.4 Business Strategy
- 8.13.5 SWOT Analysis
- 8.13.6 Strategic Implications (2025–2031)
- 8.14 Danaher (Diagnostics/Life Sciences)
- 8.14.1 Company Overview
- 8.14.2 Key Products & Segments
- 8.14.3 Financial Performance (2023–2025)
- 8.14.4 Business Strategy
- 8.14.5 SWOT Analysis
- 8.14.6 Strategic Implications (2025–2031)
- 8.15 Zimmer Biomet
- 8.15.1 Company Overview
- 8.15.2 Key Products & Segments
- 8.15.3 Financial Performance (2023–2025)
- 8.15.4 Business Strategy
- 8.15.5 SWOT Analysis
- 8.15.6 Strategic Implications (2025–2031)
- 8.16 Intuitive Surgical
- 8.16.1 Company Overview
- 8.16.2 Key Products & Segments
- 8.16.3 Financial Performance (2023–2025)
- 8.16.4 Business Strategy
- 8.16.5 SWOT Analysis
- 8.16.6 Strategic Implications (2025–2031)
- 8.17 Terumo Corporation
- 8.17.1 Company Overview
- 8.17.2 Key Products & Segments
- 8.17.3 Financial Performance (2023–2025)
- 8.17.4 Business Strategy
- 8.17.5 SWOT Analysis
- 8.17.6 Strategic Implications (2025–2031)
- 8.18 Olympus Corporation
- 8.18.1 Company Overview
- 8.18.2 Key Products & Segments
- 8.18.3 Financial Performance (2023–2025)
- 8.18.4 Business Strategy
- 8.18.5 SWOT Analysis
- 8.18.6 Strategic Implications (2025–2031)
- 8.19 Smith+Nephew
- 8.19.1 Company Overview
- 8.19.2 Key Products & Segments
- 8.19.3 Financial Performance (2023–2025)
- 8.19.4 Business Strategy
- 8.19.5 SWOT Analysis
- 8.19.6 Strategic Implications (2025–2031)
- 8.20 Edwards Lifesciences
- 8.20.1 Company Overview
- 8.20.2 Key Products & Segments
- 8.20.3 Financial Performance (2023–2025)
- 8.20.4 Business Strategy
- 8.20.5 SWOT Analysis
- 8.20.6 Strategic Implications (2025–2031)
- 8.21 Dexcom
- 8.21.1 Company Overview
- 8.21.2 Key Products & Segments
- 8.21.3 Financial Performance (2023–2025)
- 8.21.4 Business Strategy
- 8.21.5 SWOT Analysis
- 8.21.6 Strategic Implications (2025–2031)
- 8.22 Hologic
- 8.22.1 Company Overview
- 8.22.2 Key Products & Segments
- 8.22.3 Financial Performance (2023–2025)
- 8.22.4 Business Strategy
- 8.22.5 SWOT Analysis
- 8.22.6 Strategic Implications (2025–2031)
- 8.23 Insulet Corporation
- 8.23.1 Company Overview
- 8.23.2 Key Products & Segments
- 8.23.3 Financial Performance (2023–2025)
- 8.23.4 Business Strategy
- 8.23.5 SWOT Analysis
- 8.23.6 Strategic Implications (2025–2031)
- 8.24 Alcon
- 8.24.1 Company Overview
- 8.24.2 Key Products & Segments
- 8.24.3 Financial Performance (2023–2025)
- 8.24.4 Business Strategy
- 8.24.5 SWOT Analysis
- 8.24.6 Strategic Implications (2025–2031)
- 8.25 ResMed
- 8.25.1 Company Overview
- 8.25.2 Key Products & Segments
- 8.25.3 Financial Performance (2023–2025)
- 8.25.4 Business Strategy
- 8.25.5 SWOT Analysis
- 8.25.6 Strategic Implications (2025–2031)
09Competitive Landscape
- 9.1 Competitive Landscape Overview
- 9.1.1 Table 1
- 9.2 Competitive Intensity Assessment
- 9.3 Key Player Strategies & Positioning
- 9.3.1 Strategic Group Landscape
- 9.3.2 Differentiation Strategies by Strategic Group
- 9.3.3 Selected Company Financials & Growth Positioning (FY2025)
- 9.3.4 Geographic Strongholds
- 9.3.5 M&A and Partnership Activity (2022–Present)
- 9.3.6 R&D and Technology Investment Trends
- 9.4 Competitive Dynamics & Strategic Outlook
- 9.4.1 Emerging Competitive Threats & Disruption Vectors
- 9.4.2 Consolidation vs. Fragmentation Outlook
- 9.4.3 Competitive Response Matrix
- 9.4.4 Strategic Recommendations for 2025–2031
10Porter's Five Forces Analysis
- 10.1 Threat of New Entrants
- 10.2 Bargaining Power of Buyers
- 10.2.1 Key Factors
- 10.2.2 Market-Specific Context
- 10.2.3 Trend
- 10.2.4 Strategic Implication
- 10.3 Bargaining Power of Suppliers
- 10.4 Threat of Substitutes
- 10.5 Competitive Rivalry
11PESTLE Analysis
- 11.1 Political Factors
- 11.1.1 Government Healthcare Infrastructure Investment
- 11.1.2 Trade Policy and Tariff Dynamics
- 11.2 Economic Factors
- 11.2.1 Structural Demand Resilience
- 11.2.2 Capital Equipment Purchase Timing Sensitivity
- 11.2.3 Healthcare Cost Containment Pressure
- 11.3 Social and Demographic Factors
- 11.3.1 Chronic Disease Prevalence as a Structural Demand Engine
- 11.3.2 Population Ageing and Procedural Volume Growth
- 11.3.3 Shifting Patient Preferences and Consumerisation of Healthcare
- 11.4 Technological Factors
- 11.4.1 Surgical Robotics Platforms
- 11.4.2 Artificial Intelligence in Diagnostics and Device Intelligence
- 11.4.3 Connected and Wearable Monitoring Devices
- 11.5 Legal and Regulatory Factors
- 11.5.1 Device-Specific Regulatory Pathways
- 11.5.2 Regulatory Speed as a Competitive Differentiator
- 11.5.3 Post-Market Surveillance and Liability Exposure
- 11.6 Environmental Factors
- 11.6.1 Manufacturing Environmental Footprint
- 11.6.2 End-of-Life Device Disposal and Circular Economy Considerations
12SWOT Analysis
- 12.1 Introduction
- 12.2 Strengths
- 12.2.1 Scale, Diversification, and Financial Resilience of Leading Incumbents
- 12.2.2 Diversified Revenue Streams Across High-Growth Categories
- 12.2.3 Recurring Revenue Architecture and Installed Base Lock-In
- 12.2.4 Innovation Pipeline Depth Across Convergent Technology Platforms
- 12.2.5 Global Manufacturing and Distribution Infrastructure
- 12.3 Weaknesses
- 12.3.1 Regulatory Complexity and Escalating Compliance Burden
- 12.3.2 Portfolio Concentration Risk in Cyclically Sensitive Sub-Segments
- 12.3.3 Integration Risk from Aggressive M&A Activity
- 12.3.4 Supply Chain Vulnerability and Raw Material Dependencies
- 12.4 Opportunities
- 12.4.1 Demographic Inevitability
- 12.4.2 Surgical Robotics
- 12.4.3 Continuous Glucose Monitoring and Diabetes Management Technology Expansion
- 12.4.4 Artificial Intelligence Integration Across Diagnostic and Imaging Platforms
- 12.4.5 Emerging Market Healthcare Infrastructure Expansion
- 12.4.6 Portfolio Simplification and Focused Category Leadership as Value Creation Strategy
- 12.5 Threats
- 12.5.1 Pricing Pressure and Reimbursement Policy Tightening
- 12.5.2 Competitive Disruption from Technology Sector Entrants
- 12.5.3 Geopolitical Risk and Supply Chain Deglobalisation Pressures
- 12.5.4 Cybersecurity Vulnerabilities in Connected Device Ecosystems
- 12.5.5 Talent Competition and Scientific Workforce Constraints
- 12.6 Strategic Synthesis
13Future Trends & Outlook
- 13.1 Surgical Robotics
- 13.2 Connected Devices and AI Integration
- 13.3 Site-of-Care Migration
- 13.4 Long-Term Structural Outlook
Tables and figures
- 2.1 Exhibit 2.1: Forecast of Global Market YoY Growth Rate & CAGR Summary (in %)
- 2.2 Exhibit 2.2: Forecast of North America (in USD Bn)
- 2.3 Exhibit 2.3: Forecast of Europe (in USD Bn)
- 2.4 Exhibit 2.4: Forecast of Asia-Pacific (in USD Bn)
- 2.5 Exhibit 2.5: Forecast of Latin America (in USD Bn)
- 2.6 Exhibit 2.6: Forecast of Middle East & Africa (in USD Bn)
- 2.7 Exhibit 2.7: Forecast of Global (in USD Bn)
- 3.8 Exhibit 3.8: Forecast of Cardiovascular Devices (in USD Bn)
- 3.9 Exhibit 3.9: Forecast of In Vitro Diagnostics (IVD) (in USD Bn)
- 3.10 Exhibit 3.10: Forecast of Diagnostic Imaging (in USD Bn)
- 3.11 Exhibit 3.11: Forecast of Orthopedic Devices (in USD Bn)
- 3.12 Exhibit 3.12: Forecast of Surgical & Minimally Invasive/Robotic Devices (in USD Bn)
- 3.13 Exhibit 3.13: Forecast of Patient Monitoring & Diabetes Care (in USD Bn)
- 3.14 Exhibit 3.14: Forecast of Ophthalmic Devices (in USD Bn)
- 3.15 Exhibit 3.15: Forecast of Dental & Wound Care Devices (in USD Bn)
- 4.16 Exhibit 4.16: Forecast of Hospitals (in USD Bn)
- 4.17 Exhibit 4.17: Forecast of Diagnostic & Imaging Centers (in USD Bn)
- 4.18 Exhibit 4.18: Forecast of Ambulatory Surgical Centers (in USD Bn)
- 4.19 Exhibit 4.19: Forecast of Home Healthcare (in USD Bn)
- 4.20 Exhibit 4.20: Forecast of Clinics & Physician Offices (in USD Bn)
- 4.21 Exhibit 4.21: Forecast of Other (Research & Academic Institutes) (in USD Bn)
- 6.22 Exhibit 6.22: Forecast of North America (in USD Bn)
- 6.23 Exhibit 6.23: Forecast of United States (in USD Bn)
- 6.24 Exhibit 6.24: Forecast of Canada (in USD Bn)
- 6.25 Exhibit 6.25: Forecast of Rest of North America (in USD Bn)
- 6.26 Exhibit 6.26: Forecast of Europe (in USD Bn)
- 6.27 Exhibit 6.27: Forecast of Germany (in USD Bn)
- 6.28 Exhibit 6.28: Forecast of France (in USD Bn)
- 6.29 Exhibit 6.29: Forecast of United Kingdom (in USD Bn)
- 6.30 Exhibit 6.30: Forecast of Italy (in USD Bn)
- 6.31 Exhibit 6.31: Forecast of Rest of Europe (in USD Bn)
- 6.32 Exhibit 6.32: Forecast of Asia-Pacific (in USD Bn)
- 6.33 Exhibit 6.33: Forecast of China (in USD Bn)
- 6.34 Exhibit 6.34: Forecast of Japan (in USD Bn)
- 6.35 Exhibit 6.35: Forecast of South Korea (in USD Bn)
- 6.36 Exhibit 6.36: Forecast of India (in USD Bn)
- 6.37 Exhibit 6.37: Forecast of Australia (in USD Bn)
- 6.38 Exhibit 6.38: Forecast of Rest of Asia Pacific (in USD Bn)
- 6.39 Exhibit 6.39: Forecast of Latin America (in USD Bn)
- 6.40 Exhibit 6.40: Forecast of Brazil (in USD Bn)
- 6.41 Exhibit 6.41: Forecast of Mexico (in USD Bn)
- 6.42 Exhibit 6.42: Forecast of Rest of Latin America (in USD Bn)
- 6.43 Exhibit 6.43: Forecast of Middle East & Africa (in USD Bn)
- 6.44 Exhibit 6.44: Forecast of Saudi Arabia (in USD Bn)
- 6.45 Exhibit 6.45: Forecast of UAE (in USD Bn)
- 6.46 Exhibit 6.46: Forecast of South Africa (in USD Bn)
- 6.47 Exhibit 6.47: Forecast of Rest of Middle East and Africa (in USD Bn)
Frequently asked questions
What is the current size of the global medical devices market?
What is the medical devices market forecast to reach by 2031?
What is the scope of this medical devices report?
Which medical device category is the largest?
Which medical device category is growing fastest?
Which end-use setting is growing fastest for medical devices?
Which region leads the global medical devices market?
Who are the key companies covered in this report?
What is driving M&A activity in the medical devices industry?
What forecast period does this report cover?
How reliable is the medical devices market forecast?
Is the medical devices industry concentrated among a few large companies?
Research Methodology
All MarketResearchReports.com strategic research reports follow a rigorous, multi-stage methodology combining AI-assisted data synthesis with expert analyst validation.
Systematic collection from 500+ verified sources including SEC filings, industry databases (Bloomberg, Statista, OECD), regulatory filings, trade publications, patent databases, and company annual reports. AI-assisted extraction identifies relevant data points across 10,000+ documents per report.
Dual-validation approach: bottom-up sizing aggregates segment-level production, consumption, and trade data; top-down sizing cross-validates against macroeconomic indicators and total addressable market estimates. Discrepancies >5% trigger analyst review.
Company profiles built from public financial disclosures, product launches, M&A activity, job postings (as capability proxies), and supply chain mapping. Market share estimates triangulated across revenue, capacity, and shipment data.
CAGR projections use time-series regression on 5-10 years of historical data, adjusted for identified demand drivers (technology adoption curves, regulatory catalysts, demographic shifts) and demand inhibitors (cost barriers, substitution risk). Scenario modeling covers base, optimistic, and conservative cases.
All quantitative outputs reviewed by a domain-specialist analyst before publication. Data triangulation requires minimum 3 independent sources for every key figure. Reports undergo a structured peer review against our 47-point quality checklist covering methodology, data citations, logical consistency, and formatting standards.
On-demand reports are generated at time of purchase, incorporating the most recent available data. Static reports are republished when underlying market conditions shift by >10% from baseline assumptions. Purchasers receive update notifications for 12 months.
Related reports
 Navadhi Market Research · Healthcare & Medical Devices
Global Wireless Infusion Pump Safety Market Strategic Research Report
The global wireless infusion pump safety market occupies a critical intersection of medical device technology, patient safety infrastructure, and hospital informatio…
Navadhi Market Research · Healthcare & Medical DevicesGlobal Smart Medical Waste Segregation Market Strategic Research Report
The global smart medical waste segregation market occupies a critical intersection of healthcare-industry-strategic-research-report" title="Global Healthcare Industr…
Navadhi Market Research · Healthcare & Medical DevicesGlobal Microfluidic Point of Care Diagnostics Market Strategic Research Report
The global microfluidic point of care (POC) diagnostics market represents one of the most commercially consequential intersections of materials science, biomedical e…
Need a customized version?
Get country-, segment- or company-specific intelligence tailored to your exact requirements.
Request custom research →Request a free sample
Receive a sample of Global Medical Devices Industry Strategic Research Report before you buy.
Customize This Report
Describe your specific requirements and our analysts will scope and deliver a tailored version.
Request Invoice
We will email a proforma invoice within 24 hours. Report access is granted upon payment confirmation.
Leading Brands in This Industry





