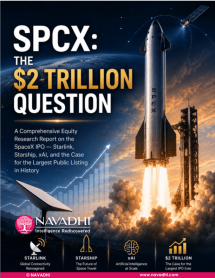
SPCX: The $2 Trillion Question A Comprehensive Equity Research Report on the SpaceX IPO - Starlink, Starship, xAI, and the Case for the Largest Public Listing in History
Key Players: Space Exploration Technologies Corp. (SpaceX)
Vista general
SpaceX filed its IPO prospectus on May 20, 2026 — targeting a $1.75–$2.0 trillion valuation, an $80 billion raise, and a Nasdaq listing under SPCX as early as June 12. It would be the largest IPO in history.
This 14-section report cuts through the noise. Written to institutional equity research standards, it draws directly from SpaceX's S-1 registration statement and layers in analyst projections, competitive benchmarking, and a structured investor framework — so you can form an evidence-based view before the stock starts trading.
───────────────────────────────────────── What's Inside? ─────────────────────────────────────────
✔ Executive Summary with risk/reward snapshot table ✔ Company Overview — history, milestones, all three business segments (Space, Connectivity, AI), and leadership structure ✔ Business Model & Revenue Streams — how SpaceX generates $18.7B in annual revenue across launch services, Starlink subscriptions, NASA/DoD contracts, and xAI ✔ Starlink Deep Dive — subscriber growth trajectory (100K → 10.3M in 5 years), ARPU dynamics, constellation overview, and competitive positioning vs. Amazon Kuiper and OneWeb ✔ Market Opportunity — global space economy ($630B in 2025, projected $1.8T by 2035), satellite broadband TAM, and the $28.5T addressable market claimed in the S-1 ✔ Competitive Landscape — SpaceX vs. Blue Origin, Rocket Lab, ULA, Arianespace, and Chinese state launch providers across 7 key metrics ✔ Financial Overview — full income statement summary (2024–Q1 2026), balance sheet highlights, and valuation multiples at both $1.75T and $2.0T (94x revenue / 266x EBITDA) ✔ IPO Details — confirmed ticker, exchange, timeline, underwriter syndicate (23 banks), dual-class share structure, and use of proceeds ✔ Bull Case vs. Bear Case — three optimistic and three cautionary scenarios with specific triggers and return implications ✔ Key Risks — 10 risks rated by severity: Musk key-person, launch failure, AI regulatory, orbital debris, capital intensity, and more ✔ ESG Analysis — environmental impact of launches, governance concerns around dual-class structure, and Starlink's digital inclusion upside ✔ Investor Verdict — decision framework by investor type (growth, value, retail, institutional, ESG) with post-IPO monitoring dashboard ✔ SWOT Analysis — color-coded 2×2 quadrant + weighted scorecard (composite score: 7.38/10) ✔ Additional Investor Resources — pre-IPO checklist, comparable company valuation table, catalysts calendar through Q1 2027, IPO mechanics, tax considerations, and further due diligence guide
───────────────────────────────────────── Who this report is for? ─────────────────────────────────────────
→ Retail investors evaluating SPCX as a long-term portfolio position → Institutional analysts building an IPO initiation model → Financial advisers preparing client briefings on the SpaceX listing → Journalists, academics, and policy researchers covering commercial space → Business school students and CFA candidates studying IPO valuation methodology
───────────────────────────────────────── Key data points in the report ─────────────────────────────────────────
• $18.67B — SpaceX's confirmed 2025 revenue (S-1) • $11.4B / 63% EBITDA margin — Starlink's 2025 financials • 10.3M — Starlink subscribers as of Q1 2026 • ~9,600 — Starlink satellites in orbit (≈65% of all active satellites globally) • $29.1B — Long-term debt as of Q1 2026 • $4.94B — GAAP net loss in 2025 (driven by AI segment) • 85% — Elon Musk's voting control post-IPO • 23 — underwriting banks in the IPO syndicate
───────────────────────────────────────── Disclaimer ─────────────────────────────────────────
This report is prepared for informational purposes only. It does not constitute financial advice, investment recommendations, or a solicitation to buy or sell any security. All S-1 figures are sourced from public filings. Analyst estimates are clearly labelled as such. Purchasers should conduct their own due diligence and consult a qualified financial adviser before making investment decisions.
Table of contents
01Executive Summary
- 1.1 Investment Thesis
- 1.2 Risk/Reward Snapshot
02Company Overview
- 2.1 History & Mission
- 2.2 Business Segments
- 2.3 Leadership
03Business Model & Revenue Streams
- 3.1 Revenue Stream Breakdown
- 3.2 Future Revenue Potential
04Starlink Deep Dive
- 4.1 Subscriber Growth
- 4.2 ARPU Dynamics - A Feature, Not a Bug
- 4.3 Constellation & Infrastructure
- 4.4 Competitive Positioning
- 4.5 Why Starlink is the IPO's Primary Valuation Driver
05Market Opportunity
- 5.1 Global Space Economy
- 5.2 Commercial Satellite Broadband
- 5.3 Launch Services
- 5.4 Defense & Government
06Competitive Landscape
- 6.1 Competitive Matrix - Launch & Space Services
- 6.2 Structural Moat Assessment
07Financial Overview
- 7.1 Balance Sheet Highlights (per S-1)
- 7.2 Valuation Benchmarks
- 7.3 Key Profitability Observation
08IPO Details & Structure
- 8.1 Timeline & Key Facts (Confirmed per S-1)
- 8.2 Underwriting Syndicate
- 8.3 Entity Structure - What Investors Are Buying
- 8.4 Use of Proceeds
09Bull case vs. Bear case
- 9.1 Bull Case Scenarios
- 9.1.1 BULL CASE 1: Starlink Achieves 100M Subscribers by 2030
- 9.1.2 BULL CASE 2: Starship Achieves Full Reusability and Sub-$100/kg Launch Costs
- 9.1.3 BULL CASE 3: AI / xAI Turns Profitable and Scales
- 9.2 Bear Case Scenarios
- 9.2.1 BEAR CASE 1: Valuation Priced for Perfection Leaves No Margin for Error
- 9.2.2 BEAR CASE 2: AI Losses Deepen; xAI Becomes a Structural Drag
- 9.2.3 BEAR CASE 3: Governance Risk Materialises
10Key Risks
11ESG Considerations
- 11.1 Environmental
- 11.1.1 Negative Factors
- 11.1.2 Positive Factors
- 11.2 Governance
- 11.3 Social
- 11.3.1 Positive Factors
- 11.3.2 Negative Factors
12Investor Verdict
- 12.1 Framework by Investor Type
- 12.2 The Core Analytical Question
- 12.3 Key Metrics to Monitor Post-IPO
13SWOT Analysis
- 13.1 Weighted SWOT Scorecard
14Additional Resources & Considerations for Investors
- 14.1 Pre-IPO Checklist - Before You Invest in SPCX
- 14.2 Comparable Company Valuation Reference
- 14.3 Key Upcoming Catalysts & Events Calendar
- 14.4 Institutional vs. Retail Access & Mechanics
- 14.5 Tax & Regulatory Considerations
- 14.6 What This Report Does Not Cover - Further Due Diligence Checklist
- Appendix: Key Terms & Abbreviations
- Notes
- Company Information
Research Methodology
All MarketResearchReports.com strategic research reports follow a rigorous, multi-stage methodology combining AI-assisted data synthesis with expert analyst validation.
Systematic collection from 500+ verified sources including SEC filings, industry databases (Bloomberg, Statista, OECD), regulatory filings, trade publications, patent databases, and company annual reports. AI-assisted extraction identifies relevant data points across 10,000+ documents per report.
Dual-validation approach: bottom-up sizing aggregates segment-level production, consumption, and trade data; top-down sizing cross-validates against macroeconomic indicators and total addressable market estimates. Discrepancies >5% trigger analyst review.
Company profiles built from public financial disclosures, product launches, M&A activity, job postings (as capability proxies), and supply chain mapping. Market share estimates triangulated across revenue, capacity, and shipment data.
CAGR projections use time-series regression on 5-10 years of historical data, adjusted for identified demand drivers (technology adoption curves, regulatory catalysts, demographic shifts) and demand inhibitors (cost barriers, substitution risk). Scenario modeling covers base, optimistic, and conservative cases.
All quantitative outputs reviewed by a domain-specialist analyst before publication. Data triangulation requires minimum 3 independent sources for every key figure. Reports undergo a structured peer review against our 47-point quality checklist covering methodology, data citations, logical consistency, and formatting standards.
On-demand reports are generated at time of purchase, incorporating the most recent available data. Static reports are republished when underlying market conditions shift by >10% from baseline assumptions. Purchasers receive update notifications for 12 months.
Related reports
 Navadhi Market Research · Aerospace & Defense
Global Defence Technology & Autonomous Systems Market Strategic Research Report
The Global Defence Technology & Autonomous Systems Market is undergoing a deep structural transformation, separating itself from traditional hardware production.…
Navadhi Market Research · Aerospace & DefenseGlobal Commercial Aviation MRO Strategic Research Report
The global commercial aviation MRO industry has fundamentally transitioned from a post-pandemic recovery phase into a structural "super cycle" that will redefine the…
Navadhi Market Research · Aerospace & DefenseGlobal Autonomous Wingman Unmanned Combat Aircraft Market Strategic Research Report
The global autonomous wingman unmanned combat aircraft (UWCA) market occupies a strategically critical position at the intersection of next-generation air combat doc…
Need a customized version?
Get country-, segment- or company-specific intelligence tailored to your exact requirements.
Request custom research →Request a free sample
Receive a sample of SPCX: The $2 Trillion Question A Comprehensive Equity Research Report on the SpaceX IPO - Starlink, Starship, xAI, and the Case for the Largest Public Listing in History before you buy.
Customize This Report
Describe your specific requirements and our analysts will scope and deliver a tailored version.
Request Invoice
We will email a proforma invoice within 24 hours. Report access is granted upon payment confirmation.
Leading Brands in This Industry