

Global Food Peptide Market Strategic Research Report
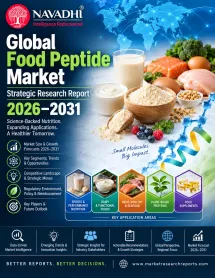
By Type: Animal-Based, Plant-Based, Marine, Microbial/Fermentation-Derived
By Application: Functional Foods & Beverages, Dietary Supplements & Nutraceuticals, Sports Nutrition, Clinical Nutrition, Infant Nutrition, Elderly/Geriatric Nutrition
Regional Forecast: Asia Pacific, Latin America, MEA, Europe, North America
Key Players: Kerry Group, ADM, Cargill, Roquette Frères, DSM-Firmenich, GELITA AG, Rousselot, Darling Ingredients, PB Leiner, Arla Foods Ingredients, Nitta Gelatin
Vista general
The global food peptide market reached an estimated USD 5.13 billion in 2025 and is projected to grow at a 7.8% CAGR to reach USD 11.24 billion by 2035, according to Global Market Insights' "Food Peptides Market" report, a published third-party industry estimate. Food peptides are gaining commercial importance as manufacturers seek ingredients offering nutritional and functional benefits (antioxidant, antihypertensive, anti-inflammatory, antimicrobial, immunomodulatory) beyond conventional protein sources, supported by advances in enzymatic hydrolysis, precision fermentation and membrane filtration processing technology.
Animal-based peptides - principally dairy, milk, fish and marine-derived - hold the largest source-segment position at USD 2.60 billion (50.7% share) in 2025, reflecting established use in nutritional and functional food applications and broad raw-material availability. Powdered form dominates delivery format at USD 2.59 billion (50.5% share), owing to convenient handling, storage, formulation flexibility and compatibility with functional foods, beverages, dietary supplements and sports nutrition products. Plant-based peptides (soy, pea, rice, wheat, canola/rapeseed) represent a smaller but fast-growing category as manufacturers diversify beyond animal sources.
Asia Pacific leads regionally at USD 1.77 billion (34.5% share) in 2025, reflecting the region's large consumer base, expanding food and beverage manufacturing base, rising health and wellness awareness, and strong growth across China, Japan, India and South Korea specifically. Real UN Comtrade trade-data analysis (HS code 3504, "Peptones and their derivatives; other protein substances and their derivatives") pulled directly for this report shows China as the largest net exporter among reporting countries (~USD 658 million surplus in 2024) and Japan as the largest net importer (~USD -274 million), with implied per-kilogram pricing ranging from approximately USD 2.50 (commodity-grade Chinese exports) to USD 42 (premium refined Japanese re-exports) - illustrating the wide value range spanned by a single HS classification.
Key manufacturers in the space include global ingredient majors (Kerry Group, ADM, Cargill, Roquette Frères, DSM-Firmenich), specialist collagen-peptide producers (GELITA AG, Rousselot/Darling Ingredients, PB Leiner), and dairy/gelatin specialists (Arla Foods Ingredients, Nitta Gelatin) - all real, named, GMI-confirmed manufacturers, not desk-research approximations.
Scope of the Global Food Peptide Market Strategic Research Report
This report provides comprehensive market sizing (value and, via real UN Comtrade trade data, indicative volume) across all major source, form, application and regional segments through 2031, benchmarked against a real, independently-published third-party market estimate rather than internally-generated figures alone. Full country-level detail is provided for all 5 regions, including Latin America and Middle East & Africa.
Segment by Source
- Animal-Based (Dairy/Milk, Fish, Meat)
- Plant-Based (Soy, Pea, Rice, Wheat, Canola)
- Marine
- Microbial/Fermentation-Derived
Segment by Application
- Functional Foods & Beverages
- Dietary Supplements & Nutraceuticals
- Sports Nutrition
- Clinical Nutrition
- Infant Nutrition
- Elderly/Geriatric Nutrition
Who Can Use This Report?
This research report is ideal for people who need a granular, country-by-country view of the global food peptide market rather than aggregate headline narratives. Some of the intended users are:
- Food and beverage manufacturers evaluating functional-ingredient sourcing
- Ingredient suppliers (ADM-style diversified majors) assessing peptide-category entry or expansion
- Nutraceutical and dietary-supplement formulators
- Investment and corporate-strategy teams assessing the food-peptide manufacturing landscape
- Trade and supply-chain professionals tracking real cross-border peptide-ingredient trade flows
Market snapshot
Global Food Peptide Market Strategic Research Report snapshot, 2026–2031
 © MarketResearchReports.comDisclaimer: The actual data may vary in the final report which undergoes verification check post order confirmation.
Segments covered in this report
Table of contents
01Executive Summary
- 1.2 Market Overview
- 1.3 Key Market Findings
- 1.4 Trade Data Intelligence
- 1.5 Competitive Landscape
- 1.6 Market Dynamics Summary
- 1.7 Regulatory Environment
- 1.8 Strategic Implications and Conclusions
02Industry Overview & Forecast
- 2.1 Market Definition and Scope
- 2.2 Headline Market Sizing
- 2.3 Independent Plausibility Cross-Check
- 2.4 Volume Analysis
- 2.5 Segmentation Overview
- 2.6 Regional Market Overview
- 2.7 Growth Rate Context and Forecast Confidence
03Market Segmentation by Type
- 3.1 Overview of Source-Type Segmentation
- 3.2 Animal-Based Peptides
- 3.3 Plant-Based Peptides
- 3.4 Marine Peptides
- 3.5 Microbial/Fermentation-Derived Peptides
- 3.6 Volume Analysis
- 3.7 Comparative Segment Summary
04Market Segmentation by Application
- 4.1 Overview and Analytical Framework
- 4.2 Functional Foods and Beverages
- 4.3 Dietary Supplements and Nutraceuticals
- 4.4 Sports Nutrition
- 4.5 Clinical Nutrition
- 4.6 Infant Nutrition
- 4.7 Elderly and Geriatric Nutrition
- 4.8 Cross-Segment Synthesis and Strategic Implications
- 4.9 Segment Summary Table Reference
05Regional Market Forecast
- 5.1 Asia Pacific
- 5.2 North America
- 5.3 Europe
- 5.4 Latin America
- 5.5 Middle East & Africa
06Country-Level Market Forecast
- 6.1 Asia Pacific
- 6.1.1 China
- 6.1.2 Japan
- 6.1.3 South Korea
- 6.1.4 India
- 6.1.5 Australia
- 6.1.6 Rest of Asia-Pacific
- 6.2 North America
- 6.2.1 USA
- 6.2.2 Canada
- 6.2.3 Mexico
- 6.2.4 Rest of North America
- 6.3 Europe
- 6.3.1 Germany
- 6.3.2 France
- 6.3.3 United Kingdom
- 6.3.4 Netherlands
- 6.3.5 Belgium
- 6.3.6 Rest of Europe
- 6.4 Latin America
- 6.4.1 Brazil
- 6.4.2 Argentina
- 6.4.3 Rest of Latin America
- 6.5 Middle East & Africa
- 6.5.1 Saudi Arabia
- 6.5.2 UAE
- 6.5.3 South Africa
- 6.5.4 Rest of Middle East & Africa
07Growth Drivers & Inhibitors
- 7.1 Market Drivers
- 7.2 Market Restraints
- 7.3 Market Opportunities
- 7.4 Market Challenges
08Key Company Profiles
- 8.1 Kerry Group
- 8.2 ADM
- 8.3 Cargill
- 8.4 Roquette Frères
- 8.5 DSM-Firmenich
- 8.6 GELITA AG
- 8.7 Rousselot
- 8.8 Darling Ingredients
- 8.9 PB Leiner
- 8.10 Arla Foods Ingredients
- 8.11 Nitta Gelatin
09Competitive Landscape
- 9.1 Competitive Landscape Overview
- 9.2 Competitive Intensity Assessment
- 9.3 Key Player Strategies & Positioning
- 9.4 Competitive Dynamics & Strategic Outlook
10Porter's Five Forces Analysis
- 10.1 Threat of New Entrants
- 10.2 Bargaining Power of Buyers
- 10.3 Bargaining Power of Suppliers
- 10.4 Threat of Substitutes
- 10.5 Competitive Rivalry
11PESTLE Analysis
- 11.1 Overview
- 11.2 Political
- 11.3 Economic
- 11.4 Sociocultural
- 11.5 Technological
- 11.6 Legal and Regulatory
- 11.7 Environmental
- 11.8 PESTLE Summary Assessment
12SWOT Analysis
- 12.1 Strengths
- 12.2 Weaknesses
- 12.3 Opportunities
- 12.4 Threats
- 12.5 Strategic Synthesis
13Future Trends & Outlook
- 13.1 Structural Forces Shaping the Global Food Peptide Market Throu…
- 13.2 Precision Fermentation as a Structural Manufacturing Shift
- 13.3 Plant-Based and Marine Peptide Diversification
- 13.4 Application-Level Expansion into Specialized Nutrition Segments
- 13.5 Asia Pacific's Continued Regional Leadership
- 13.6 Regulatory Convergence and Divergence as a Strategic Variable
- 13.7 Competitive Landscape Evolution and Strategic Implications
- 13.8 Summary Outlook
Tables and figures
- 2.1 Exhibit 2.1: Forecast of Global Market YoY Growth Rate & CAGR Summary (in %)
- 2.2 Exhibit 2.2: Forecast of Global Market YoY Growth Rate & CAGR Summary (in %)
- 2.3 Exhibit 2.3: Forecast of Global (in USD Bn)
- 2.4 Exhibit 2.4: Forecast of Asia Pacific (in USD Bn)
- 2.5 Exhibit 2.5: Forecast of North America (in USD Bn)
- 2.6 Exhibit 2.6: Forecast of Europe (in USD Bn)
- 2.7 Exhibit 2.7: Forecast of Latin America (in USD Bn)
- 2.8 Exhibit 2.8: Forecast of Middle East & Africa (in USD Bn)
- 2.9 Exhibit 2.9: Forecast of Global (in kmt)
- 2.10 Exhibit 2.10: Forecast of Asia Pacific (in kmt)
- 2.11 Exhibit 2.11: Forecast of North America (in kmt)
- 2.12 Exhibit 2.12: Forecast of Europe (in kmt)
- 2.13 Exhibit 2.13: Forecast of Latin America (in kmt)
- 2.14 Exhibit 2.14: Forecast of Middle East & Africa (in kmt)
- 3.15 Exhibit 3.15: Forecast of Animal-Based (Dairy/Milk, Fish, Meat) (in USD Bn)
- 3.16 Exhibit 3.16: Forecast of Animal-Based (Dairy/Milk, Fish, Meat) (in kmt)
- 3.17 Exhibit 3.17: Forecast of Plant-Based (Soy, Pea, Rice, Wheat, Canola) (in USD Bn)
- 3.18 Exhibit 3.18: Forecast of Plant-Based (Soy, Pea, Rice, Wheat, Canola) (in kmt)
- 3.19 Exhibit 3.19: Forecast of Marine (Fish, Algae, Crustacean) (in USD Bn)
- 3.20 Exhibit 3.20: Forecast of Marine (Fish, Algae, Crustacean) (in kmt)
- 3.21 Exhibit 3.21: Forecast of Microbial/Fermentation-Derived (in USD Bn)
- 3.22 Exhibit 3.22: Forecast of Microbial/Fermentation-Derived (in kmt)
- 4.23 Exhibit 4.23: Forecast of Functional Foods & Beverages (in USD Bn)
- 4.24 Exhibit 4.24: Forecast of Functional Foods & Beverages (in kmt)
- 4.25 Exhibit 4.25: Forecast of Dietary Supplements & Nutraceuticals (in USD Bn)
- 4.26 Exhibit 4.26: Forecast of Dietary Supplements & Nutraceuticals (in kmt)
- 4.27 Exhibit 4.27: Forecast of Sports Nutrition (in USD Bn)
- 4.28 Exhibit 4.28: Forecast of Sports Nutrition (in kmt)
- 4.29 Exhibit 4.29: Forecast of Clinical Nutrition (in USD Bn)
- 4.30 Exhibit 4.30: Forecast of Clinical Nutrition (in kmt)
- 4.31 Exhibit 4.31: Forecast of Infant Nutrition (in USD Bn)
- 4.32 Exhibit 4.32: Forecast of Infant Nutrition (in kmt)
- 4.33 Exhibit 4.33: Forecast of Elderly/Geriatric Nutrition (in USD Bn)
- 4.34 Exhibit 4.34: Forecast of Elderly/Geriatric Nutrition (in kmt)
- 6.35 Exhibit 6.35: Forecast of Asia Pacific (in USD Bn)
- 6.36 Exhibit 6.36: Forecast of China (in USD Bn)
- 6.37 Exhibit 6.37: Forecast of Japan (in USD Bn)
- 6.38 Exhibit 6.38: Forecast of South Korea (in USD Bn)
- 6.39 Exhibit 6.39: Forecast of India (in USD Bn)
- 6.40 Exhibit 6.40: Forecast of Australia (in USD Bn)
- 6.41 Exhibit 6.41: Forecast of Rest of Asia-Pacific (in USD Bn)
- 6.42 Exhibit 6.42: Forecast of Asia Pacific (in kmt)
- 6.43 Exhibit 6.43: Forecast of China (in kmt)
- 6.44 Exhibit 6.44: Forecast of Japan (in kmt)
- 6.45 Exhibit 6.45: Forecast of South Korea (in kmt)
- 6.46 Exhibit 6.46: Forecast of India (in kmt)
- 6.47 Exhibit 6.47: Forecast of Australia (in kmt)
- 6.48 Exhibit 6.48: Forecast of Rest of Asia-Pacific (in kmt)
- 6.49 Exhibit 6.49: Forecast of North America (in USD Bn)
- 6.50 Exhibit 6.50: Forecast of USA (in USD Bn)
- 6.51 Exhibit 6.51: Forecast of Canada (in USD Bn)
- 6.52 Exhibit 6.52: Forecast of Mexico (in USD Bn)
- 6.53 Exhibit 6.53: Forecast of Rest of North America (in USD Bn)
- 6.54 Exhibit 6.54: Forecast of North America (in kmt)
- 6.55 Exhibit 6.55: Forecast of USA (in kmt)
- 6.56 Exhibit 6.56: Forecast of Canada (in kmt)
- 6.57 Exhibit 6.57: Forecast of Mexico (in kmt)
- 6.58 Exhibit 6.58: Forecast of Rest of North America (in kmt)
- 6.59 Exhibit 6.59: Forecast of Latin America (in USD Bn)
- 6.60 Exhibit 6.60: Forecast of Rest of Latin America (in USD Bn)
- 6.61 Exhibit 6.61: Forecast of Latin America (in kmt)
- 6.62 Exhibit 6.62: Forecast of Rest of Latin America (in kmt)
- 6.63 Exhibit 6.63: Forecast of Europe (in USD Bn)
- 6.64 Exhibit 6.64: Forecast of Germany (in USD Bn)
- 6.65 Exhibit 6.65: Forecast of France (in USD Bn)
- 6.66 Exhibit 6.66: Forecast of United Kingdom (in USD Bn)
- 6.67 Exhibit 6.67: Forecast of Netherlands (in USD Bn)
- 6.68 Exhibit 6.68: Forecast of Belgium (in USD Bn)
- 6.69 Exhibit 6.69: Forecast of Rest of Europe (in USD Bn)
- 6.70 Exhibit 6.70: Forecast of Europe (in kmt)
- 6.71 Exhibit 6.71: Forecast of Germany (in kmt)
- 6.72 Exhibit 6.72: Forecast of France (in kmt)
- 6.73 Exhibit 6.73: Forecast of United Kingdom (in kmt)
- 6.74 Exhibit 6.74: Forecast of Netherlands (in kmt)
- 6.75 Exhibit 6.75: Forecast of Belgium (in kmt)
- 6.76 Exhibit 6.76: Forecast of Rest of Europe (in kmt)
- 6.77 Exhibit 6.77: Forecast of Middle East & Africa (in USD Bn)
- 6.78 Exhibit 6.78: Forecast of Rest of Middle East & Africa (in USD Bn)
- 6.79 Exhibit 6.79: Forecast of Middle East & Africa (in kmt)
- 6.80 Exhibit 6.80: Forecast of Rest of Middle East & Africa (in kmt)
Frequently asked questions
What is the size of the global food peptide market?
Which source segment is largest?
Which region leads the market?
Does this report cover Latin America and Middle East & Africa at the country level?
Does this report include real trade data?
Who are the key manufacturers?
Research Methodology
All MarketResearchReports.com strategic research reports follow a rigorous, multi-stage methodology combining AI-assisted data synthesis with expert analyst validation.
Systematic collection from 500+ verified sources including SEC filings, industry databases (Bloomberg, Statista, OECD), regulatory filings, trade publications, patent databases, and company annual reports. AI-assisted extraction identifies relevant data points across 10,000+ documents per report.
Dual-validation approach: bottom-up sizing aggregates segment-level production, consumption, and trade data; top-down sizing cross-validates against macroeconomic indicators and total addressable market estimates. Discrepancies >5% trigger analyst review.
Company profiles built from public financial disclosures, product launches, M&A activity, job postings (as capability proxies), and supply chain mapping. Market share estimates triangulated across revenue, capacity, and shipment data.
CAGR projections use time-series regression on 5-10 years of historical data, adjusted for identified demand drivers (technology adoption curves, regulatory catalysts, demographic shifts) and demand inhibitors (cost barriers, substitution risk). Scenario modeling covers base, optimistic, and conservative cases.
All quantitative outputs reviewed by a domain-specialist analyst before publication. Data triangulation requires minimum 3 independent sources for every key figure. Reports undergo a structured peer review against our 47-point quality checklist covering methodology, data citations, logical consistency, and formatting standards.
On-demand reports are generated at time of purchase, incorporating the most recent available data. Static reports are republished when underlying market conditions shift by >10% from baseline assumptions. Purchasers receive update notifications for 12 months.
Related reports
 Navadhi Market Research · Food & Beverages
Global Infant Formula Human Milk Oligosaccharides Market Strategic Research Report
The global infant formula human milk oligosaccharides (HMO) market has emerged as one of the most scientifically significant and commercially consequential segments …
Navadhi Market Research · Food & BeveragesGlobal Automated Commercial Kitchen Robotics Market Strategic Research Report
The global automated commercial kitchen robotics market is undergoing a decisive structural shift as food service operators confront a persistent labor shortage, mou…
Navadhi Market Research · Food & BeveragesGlobal Direct To Consumer Coffee Subscription Market Strategic Research Report
The global direct-to-consumer (DTC) coffee subscription market has emerged as one of the most commercially compelling intersections of specialty food culture, recurr…
Need a customized version?
Get country-, segment- or company-specific intelligence tailored to your exact requirements.
Request custom research →Request a free sample
Receive a sample of Global Food Peptide Market Strategic Research Report before you buy.
Customize This Report
Describe your specific requirements and our analysts will scope and deliver a tailored version.
Request Invoice
We will email a proforma invoice within 24 hours. Report access is granted upon payment confirmation.
Leading Brands in This Industry



