

Global Fertilizer Market Strategic Research Report

Regional Forecast: Asia Pacific, Latin America, MEA, Europe, North America
Key Players: Nutrien Ltd. (TSX/NYSE: NTR), Yara International ASA (Oslo: YAR), The Mosaic Company (NYSE: MOS), OCP Group, ICL Group Ltd. (NYSE/TASE: ICL), CF Industries Holdings, Inc. (NYSE: CF), PhosAgro PJSC (MOEX: PHOR), EuroChem Group AG, K+S Aktiengesellschaft (SDAX: SDX), Sociedad Qu\u00edmica y Minera de Chile (SQM) (NYSE/BVL: SQM)
Overzicht
The global fertilizer market is transitioning from a post-shock recovery phase into a period of structurally anchored, gradually accelerating growth. The global fertilizer landscape has shifted from a period of "constrained equilibrium" into a state of active structural rupture. As of March 2026, the industry is no longer merely navigating the tailwinds of 2022; it is being forcibly rewired by the March 2026 Iran Conflict, which has surpassed previous benchmarks for geopolitical risk. The global fertilizer market is expected to be worth USD 283.03 billion by 2031.
As per this report, the global fertilizer market, which was worth USD 226 billion in 2025, is expected to grow at a CAGR of 3.90% between 2026 and 2031. The global Fertilizer market is expected to be worth USD 283.03 billion by 2031.
The global fertilizer market is sized on a standard scope basis encompassing mineral nitrogen, phosphate, potash and compound NPK fertilizers, organic fertilizers, and biofertilizers. Crop protection chemicals, soil amendments, and seed treatments are excluded. Market value is expressed in USD at prevailing FOB (Free on Board)/ CIF (Cost, Insurance, and Freight) prices for each forecast year, reflecting NAVADHI's proprietary price-volume decomposition model.
As per this research report, nitrogen fertilizers constitute the largest segment of the global fertilizer market and will retain that position through 2031, albeit with a declining share of the total market. The global nitrogen fertilizer segment is expected to grow at a CAGR of 2.54% during the forecast period of 2026-2031. It is the lowest among the four segments and reflects a structurally maturing market where volume growth is being moderated by "nutrient use efficiency" (NUE) pressures even as absolute revenue continues to expand.
The primary driver of volume demand remains food calorie production, given that nitrogen (principally as urea) is the single most important yield-determining input for cereals, which provide approximately 50% of global calorie supply. Urea alone accounts for approximately 55–58% of nitrogen fertilizer revenue, with ammonium nitrate, UAN, CAN, and ammonium sulfate comprising the balance.
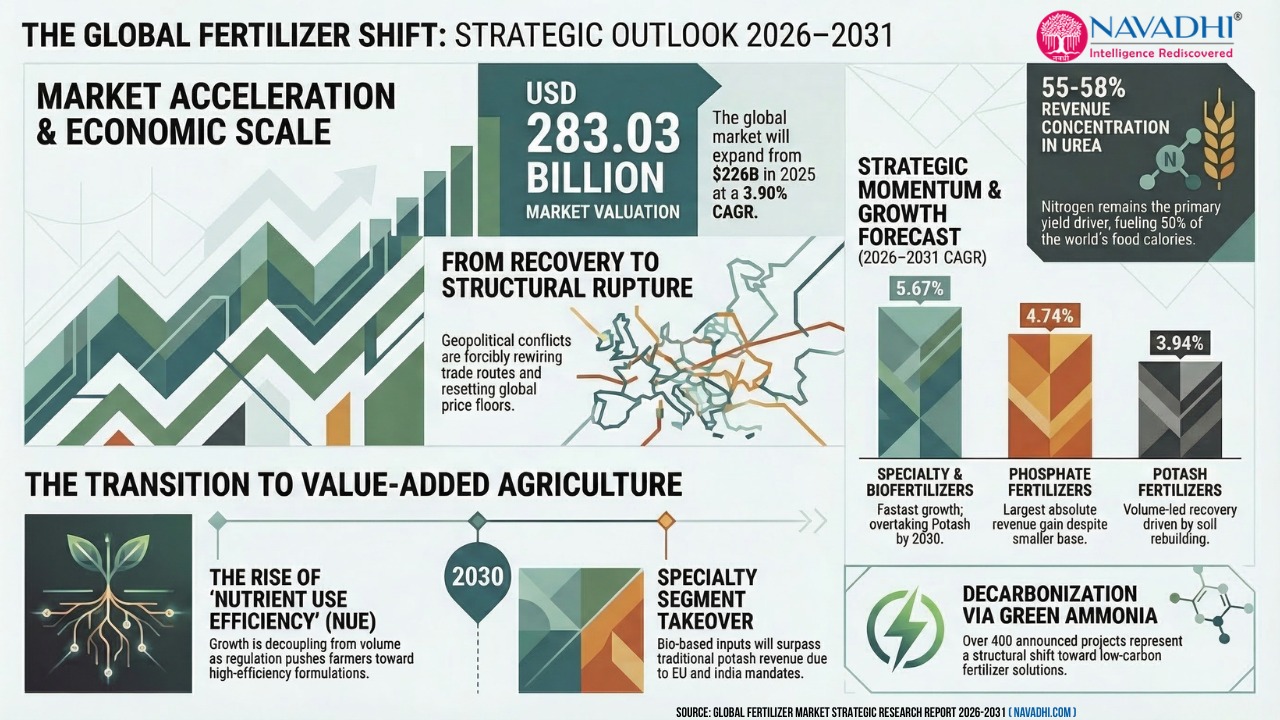
The global phosphate fertilizers segment, which has the second-largest market share, is expected to deliver the largest absolute revenue gain over the forecast period of 2026-2031 despite being a smaller base. The phosphate fertilizers segment is expected to grow at a CAGR of 4.74%, which reflects a segment where supply-side structural tightening is the primary pricing driver, compounding on top of solid underlying volume demand growth.
DAP (diammonium phosphate) is the globally dominant product form with approximately 37–46% of phosphate fertilizer revenue, followed by MAP (monoammonium phosphate), TSP (triple superphosphate), and SSP. China, historically the world's largest phosphate exporter and a price-suppressing safety valve for global markets, has systematically restricted phosphate exports since 2021 through quota and licence mechanisms. This structural supply withdrawal - driven by China's desire to retain phosphate resources for domestic food security - has permanently reset the global phosphate price floor. DAP prices rose from approximately USD 336/tonne in early 2024 to USD 437/tonne by May 2025, a 30% increase that flows directly through to segment revenue.
The global potash fertilizers segment is the most volume-sensitive segment, where demand is primarily driven by agronomic necessity, i.e., crop potassium uptake, rather than by policy incentives or premium-product adoption. MOP (muriate of potash, potassium chloride) accounts for approximately 86% of the potash fertilizer market by value, with SOP (sulphate of potash) occupying the premium niche for chloride-sensitive crops and controlled-environment agriculture.
The global potash fertilizers segment is expected to grow at a CAGR of 3.94% till 2031 and is positioned as a volume-led, moderately price-supported growth segment. The medium-term outlook by the International Fertilizer Association (IFA) projects potash consumption growth of approximately 10% between 2024 and 2028, which is the highest volume growth rate among the three macronutrients, reflecting crop nutrient depletion rebuilding after the 2022–23 affordability shock caused sharp demand destruction. Brazilian soil rebuilding demand (where potash application rates declined significantly in 2022–23 as prices peaked) is a meaningful recovery driver through 2027.
The global specialty & biofertilizers segment is expected to show the fastest growth at a CAGR of 5.67% till 2031. This report finds that the global specialty & biofertilizers segment is expected to overtake the global potash fertilizers segment by 2030 in terms of overall revenue-based market share which signals the beginning of a structural rebalancing of the fertilizer market away from pure commodity inputs toward value-added, precision, and biological alternatives. This expected growth of the global specialty & biofertilizers segment is mainly attributed to the following independently powerful growth forces that are still in their early-to-mid adoption phase –
EU Farm to Fork Strategy mandates a 20% reduction in chemical fertilizer use by 2030, thus explicitly pushing farmers toward enhanced-efficiency and bio-based alternatives. This policy simultaneously reduces commodity fertilizer volume in Europe while creating substantial demand pull for premium, high-efficiency, and biological alternatives — the exact product categories within this segment.
India's PM-PRANAM (PM Program for Restoration, Awareness Generation, Nourishment, and Amelioration of Mother Earth) scheme (promoting bio and organic inputs) reaches full implementation scale by 2029–30
Nano fertilizer manufacturing in India, Brazil, and China crosses commercial viability thresholds as IFFCO's technology licences spread globally
Carbon credit schemes for precision fertilizer applications reach sufficient scale to create measurable demand pull in Europe and North America.
However, this growth is increasingly decoupled from simple volume expansion; the industry is shifting toward "value-per-nutrient" through precision application technologies, specialty formulations, and digital agronomy.
Geopolitical risks have transitioned from peripheral concerns to central determinants of market stability. The persistent Russia-Ukraine conflict and volatility in the Strait of Hormuz—a corridor handling 35% of global urea trade—have forced a fundamental "structural rewiring" of global trade routes. This has led to a bifurcation of the market: one segment focused on low-cost, resource-heavy production in regions like West Asia and Russia, and another pursuing high-tech, low-carbon solutions in North America and Europe.
Sustainability has emerged as a disruptive force. The expansion of green ammonia capacity, driven by over 400 announced projects, represents a long-term decarbonization. Concurrently, the rise of "nutrient use efficiency" (NUE) as a regulatory and economic priority is fueling the liquid and controlled-release segments, outpacing traditional dry/granular products.
This report identifies population growth & food security imperative, emerging market agricultural intensification, crop price transmission & farmer purchasing power, geopolitical supply tightening - price floor effect, government policy & subsidy support, specialty & biofertilizer premiumisation wave, green & low-carbon fertilizer premium market, precision agriculture - product mix upgrade and ex-china supply chain build-out (sovereign capital) as nine key growth drivers for the global fertilizer market during the forecast period of 2026-2031.
Chinese export control escalation, extreme commodity price volatility, high energy cost sensitivity - nitrogen competitiveness, western permitting & regulatory delay, nano & biofertilizer volume displacement, regulatory volume restrictions (eu farm to fork), russian/belarusian potash re-entry risk, smallholder distribution & affordability gap and climate volatility & demand uncertainty were identified as the nine key pain areas/growth inhibitors affecting the global fertilizer market during the forecast period of 2026-2031.
Scope of Global Fertilizer Market Strategic Research Report 2026-2031
- This report provides forecast data till 2031 for the global Fertilizer market and its segments (nitrogen fertilizers, phosphate fertilizers, potash fertilizers, and specialty & biofertilizers), thus covering all aspects of the industry.
- This report identifies key growth drivers and inhibitors (pain points) affecting the global fertilizer market.
- This report provides SWOT (Strengths, Weaknesses, Opportunities and Threats) analysis and competitive landscape for 10 key companies (Nutrien Ltd. (TSX/NYSE: NTR), Yara International ASA (Oslo: YAR), The Mosaic Company (NYSE: MOS), OCP Group, ICL Group Ltd. (NYSE/TASE: ICL), CF Industries Holdings, Inc. (NYSE: CF), PhosAgro PJSC (MOEX: PHOR), EuroChem Group AG, K+S Aktiengesellschaft (SDAX: SDX) and Sociedad Química y Minera de Chile (SQM) (NYSE/BVL: SQM)) in the global fertilizer market.
- This report provides Porter’s Five Forces analysis for the global fertilizer market.
- This report provides PESTLE (political, economic, social, technological, legal, and environmental) analysis for the global fertilizer market.
- This report provides a SWOT (Strengths, Weaknesses, Opportunities and Threats) analysis for the global fertilizer market.
- This report identifies key future trends in the global Fertilizer market.
Who can use the Global Fertilizers Market Research Report?
This research report is ideal for people who wish to gain a thorough understanding of the fertilizer market. Some of the intended users for this report are:
- C-level executives
- Company Directors
- Industry consultants
- Marketing professionals
- Business development professionals
- Management consultants
- Investment managers
- Financial professionals
- Venture Capitalists
- Bank Managers
- M&A Managers
- Auditors
- Anyone operating in the fertilizer industry value chain.
Market snapshot
Global Fertilizer Market Strategic Research Report snapshot, 2025–2031
 © MarketResearchReports.comDisclaimer: The actual data may vary in the final report which undergoes verification check post order confirmation.
Table of contents
01Executive Summary
- Scope of Global Fertilizer Market Strategic Research Report 2026-2031
- Research Methodology
02Forecast for Global Fertilizer Market 2026-2031
- 2.1 Overall Global Fertilizer Market Forecast 2026-2031
- 2.2 Segment-Wise Market Share in Global Fertilizer Market 2026
- 2.2.1 Global Nitrogen Fertilizers Market Forecast 2026-2031
- 2.2.2 Global Phosphate Fertilizers Market Forecast 2026-2031
- 2.2.3 Global Potash Fertilizers Market Forecast 2026-2031
- 2.2.4 Global Specialty & Biofertilizers Market Forecast 2026-2031
03Key Growth Drivers for Global Fertilizer Market
- 3.1 Population Growth & Food Security Imperative
- 3.2 Emerging Market Agricultural Intensification
- 3.3 Crop Price Transmission & Farmer Purchasing Power
- 3.4 Geopolitical Supply Tightening — Structural Price Floor Effect
- 3.5 Government Policy & Subsidy Support
- 3.6 Specialty & Biofertilizer Premiumisation Wave
- 3.7 Green & Low-Carbon Fertilizer Premium Market
- 3.8 Precision Agriculture - Product Mix Revenue Upgrade
- 3.9 Ex-China Supply Chain Build-Out (Sovereign Capital)
04Key Pain Areas / Growth Inhibitors for Global Fertilizer Market
- 4.1 Chinese Export Control Escalation
- 4.2 Extreme Commodity Price Volatility
- 4.3 High Energy Cost Sensitivity - Nitrogen Competitiveness
- 4.4 Western Permitting & Regulatory Delay
- 4.5 Nano & Biofertilizer Volume Displacement
- 4.6 Regulatory Volume Restrictions - EU Farm to Fork & Analogues
- 4.7 Russian/Belarusian Potash Re-entry Risk
- 4.8 Smallholder Distribution & Affordability Gap
- 4.9 Climate Volatility & Agricultural Demand Uncertainty
05Porter’s Five Forces Analysis of Global Fertilizer Market
- 5.1 Bargaining Power of Suppliers: High
- 5.2 Bargaining Power of Buyers: Medium
- 5.3 Threat of New Entrants: Low
- 5.4 Threat of Substitution: Low - Medium
- 5.5 Competitive Rivalry Among Existing Players: High
06Key Players in Global Fertilizers Market – Competitive Landscape and SWOT Analysis
- 6.1 Nutrien Ltd.
- 6.1.1 SWOT Analysis of Nutrien Ltd.
- 6.2 Yara International
- 6.2.1 SWOT Analysis of Yara International
- 6.3 The Mosaic Company
- 6.3.1 SWOT Analysis of The Mosaic Company
- 6.4 OCP Group
- 6.4.1 SWOT Analysis of OCP Group
- 6.5 ICL Group Ltd.
- 6.5.1 SWOT Analysis of ICL Group Ltd.
- 6.6 CF Industries Holdings, Inc.
- 6.6.1 SWOT Analysis of CF Industries Holdings, Inc.
- 6.7 PhosAgro PJSC
- 6.7.1 SWOT Analysis of PhosAgro PJSC
- 6.8 EuroChem Group AG
- 6.8.1 SWOT Analysis of EuroChem Group AG
- 6.9 K+S Aktiengesellschaft
- 6.9.1 SWOT Analysis of K+S Aktiengesellschaft
- 6.10 Sociedad Química y Minera de Chile (SQM)
- 6.10.1 SWOT Analysis of Sociedad Química y Minera de Chile (SQM)
- 6.11 Competitive Landscape of Key Players in the Global Fertilizer Market
07PESTLE Analysis of Global Fertilizer Market
- 7.1 Political (P)
- 7.2 Economic (E)
- 7.3 Social (S)
- 7.4 Technological (T)
- 7.5 Legal (L)
- 7.6 Environmental (E)
08SWOT Analysis of Global Fertilizer Market
- 8.1 Strengths
- 8.2 Weaknesses
- 8.3 Opportunities
- 8.4 Threats
09Future Trends in Global Fertilizer Market
- 9.1 Geopolitical Bifurcation of Global Fertilizer Supply Chains
- 9.2 Green Ammonia & the Low-Carbon Nitrogen Transition
- 9.3 Nano-Fertilizer Commercial Globalisation
- 9.4 Biological Inputs & Microbiome Agriculture Revolution
- 9.5 Africa Emerges as the Next Major Fertilizer Demand Growth Region
- 9.6 Precision Nutrition - From Mass Application to Prescription Micro-Dosing
- 9.7 Circular Economy & Phosphorus Recovery at Commercial Scale
- 9.8 Supply Chain Friend-shoring & Strategic Stockpiling
- 9.9 Specialty & Bio Crossing Commodity Potash - A Structural Market Rebalancing
- 9.10 Carbon Markets & Agricultural Decarbonisation Premium
- List of Exhibits
- Notes
- Company Information
Tables and figures
List of Exhibits
- Exhibit 1.1 Global Fertilizer Market 2026-2031 Infographic
- Exhibit 2.1 Forecast of Global Fertilizer Market 2026-2031 (in USD billion)
- Exhibit 2.2 Segment-Wise Market Share in Global Fertilizer Market 2026 (in % and USD billion)
- Exhibit 2.3 Segment-Wise CAGR Growth Rate in Global Fertilizer Market 2026-2031 (in %)
- Exhibit 2.4 Forecast of Global Nitrogen Fertilizers Market 2026-2031 (in USD billion)
- Exhibit 2.5 Forecast of Global Phosphate Fertilizers Market 2026-2031 (in USD billion)
- Exhibit 2.6 Forecast of Global Potash Fertilizers Market 2026-2031 (in USD billion)
- Exhibit 2.7 Forecast of Global Specialty & Biofertilizers Market 2026-2031 (in USD billion)
- Exhibit 3.1 Key Growth Drivers for Global Fertilizers Market
- Exhibit 4.1 Key Pain Areas / Growth Inhibitors for Global Fertilizers Market
- Exhibit 5.1 Porter’s Five Forces Analysis for Global Fertilizers Market
- Exhibit 6.1 SWOT Analysis of Nutrien Ltd.
- Exhibit 6.2 SWOT Analysis of Yara International
- Exhibit 6.3 SWOT Analysis of The Mosaic Company
- Exhibit 6.4 SWOT Analysis of OCP Group
- Exhibit 6.5 SWOT Analysis of ICL Group Ltd.
- Exhibit 6.6 SWOT Analysis of CF Industries Holdings, Inc.
- Exhibit 6.7 SWOT Analysis of PhosAgro PJSC
- Exhibit 6.8 SWOT Analysis of EuroChem Group AG
- Exhibit 6.9 SWOT Analysis of K+S Aktiengesellschaft
- Exhibit 6.10 SWOT Analysis of Sociedad Química y Minera de Chile (SQM)
- Exhibit 6.11 Competitive Landscape of Key Players in the Global Fertilizer Market
- Exhibit 7.1 PESTLE Analysis for Global Fertilizers Market
- Exhibit 8.1 SWOT Analysis of Global Fertilizer Market
- Exhibit 9.1 Key Future Trends of Global Fertilizer Market
Research Methodology
All MarketResearchReports.com strategic research reports follow a rigorous, multi-stage methodology combining AI-assisted data synthesis with expert analyst validation.
Systematic collection from 500+ verified sources including SEC filings, industry databases (Bloomberg, Statista, OECD), regulatory filings, trade publications, patent databases, and company annual reports. AI-assisted extraction identifies relevant data points across 10,000+ documents per report.
Dual-validation approach: bottom-up sizing aggregates segment-level production, consumption, and trade data; top-down sizing cross-validates against macroeconomic indicators and total addressable market estimates. Discrepancies >5% trigger analyst review.
Company profiles built from public financial disclosures, product launches, M&A activity, job postings (as capability proxies), and supply chain mapping. Market share estimates triangulated across revenue, capacity, and shipment data.
CAGR projections use time-series regression on 5-10 years of historical data, adjusted for identified demand drivers (technology adoption curves, regulatory catalysts, demographic shifts) and demand inhibitors (cost barriers, substitution risk). Scenario modeling covers base, optimistic, and conservative cases.
All quantitative outputs reviewed by a domain-specialist analyst before publication. Data triangulation requires minimum 3 independent sources for every key figure. Reports undergo a structured peer review against our 47-point quality checklist covering methodology, data citations, logical consistency, and formatting standards.
On-demand reports are generated at time of purchase, incorporating the most recent available data. Static reports are republished when underlying market conditions shift by >10% from baseline assumptions. Purchasers receive update notifications for 12 months.
Related reports
 Navadhi Market Research · Agriculture & Agritech
Impact of 2026 Iran War on Global Fertilizer Market Strategic Research Report
The 2026 Iran War has triggered the most acute fertilizer supply crisis in modern history - one that is structurally broader, geographically deeper, and agronomicall…
Navadhi Market Research · Agriculture & AgritechGlobal Bio-Based Nematicide Market Strategic Research Report
The global bio-based nematicide market occupies an increasingly critical position within the broader crop protection industry, as agricultural producers worldwide se…
Navadhi Market Research · Agriculture & AgritechGlobal Synthetic Biology Forage Crop Market Strategic Research Report
The global synthetic biology forage crop market occupies a strategically critical intersection of agricultural biotechnology, livestock feed supply chains, and preci…
Need a customized version?
Get country-, segment- or company-specific intelligence tailored to your exact requirements.
Request custom research →Request a free sample
Receive a sample of Global Fertilizer Market Strategic Research Report before you buy.
Customize This Report
Describe your specific requirements and our analysts will scope and deliver a tailored version.
Request Invoice
We will email a proforma invoice within 24 hours. Report access is granted upon payment confirmation.
Leading Brands in This Industry



