

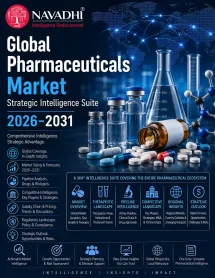
Global Pharmaceuticals Market Strategic Intelligence Suite
Regional Forecast: Asia Pacific, Latin America, MEA, Europe, North America
Key Players: Johnson &, Johnson, Pfizer, Roche, Merck &, Co. (MSD), AbbVie, Novartis, AstraZeneca, Sanofi, Bristol-Myers Squibb, Eli Lilly, GSK, Novo Nordisk, Takeda, Bayer, Boehringer Ingelheim, Amgen, Gilead Sciences, Vertex Pharmaceuticals, Regeneron Pharmaceuticals, Biogen, Moderna, Teva Pharmaceutical Industries, Viatris, Sun Pharmaceutical Industries, Dr. Reddy's Laboratories, Samsung Biologics, Lonza, WuXi Biologics, Catalent (29 unique companies)
Overzicht
The Global Pharmaceuticals Market Strategic Intelligence Suite 2026-2031 is Navadhi Market Research's most comprehensive offering on the global pharmaceutical industry. This suite bundles two full-length strategic research reports -- covering the entire pharmaceutical value chain from manufacturing and production capacity through to end-market consumption and drug spending -- together with an exclusive Executive Presentation, a cross-report Summary Document, and an interactive Infographic.
The Global Pharmaceuticals Industry Strategic Research Report (consumption/demand-side) was valued at $1.66 trillion in 2025 and is projected to reach $2.45 trillion by 2031, a CAGR of 6.8%, with GLP-1 and cardiometabolic franchise expansion the single largest growth contributor, adding an estimated $280 billion of incremental value by 2031. Twenty-five companies are profiled in depth.
The Global Pharmaceuticals Manufacturing Market Strategic Research Report (production/supply-side) was valued at $1.84 trillion in 2025 and is projected to reach $2.86 trillion by 2031, a CAGR of 7.7% -- the fastest sustained production growth rate in the industry's modern history. GLP-1 manufacturing capacity alone is forecast to grow from $45 billion to $180 billion by 2031. Twenty-nine companies are profiled, including 25 integrated innovators and four dedicated CDMOs (Samsung Biologics, Lonza, WuXi Biologics, Catalent).
The single most important finding when viewing both reports together is structural: global pharmaceutical production value consistently exceeds drug market consumption value, and grows at a higher CAGR (7.7% vs. 6.8%). North America consumes 46.8% of global drug spending but produces only 36.7% of global pharmaceutical output -- a structural trade deficit of approximately $90 billion in 2025, widening to approximately $191 billion by 2031. Europe is the largest net exporter, at +$281 billion in 2025, growing to +$528 billion by 2031.
In addition to the two full-length research reports, the suite includes three exclusive deliverables: a 10-slide Executive Presentation providing a cross-report visual summary of key findings and the production-consumption linkage; a Summary Document explaining how the two markets interconnect across the pharmaceutical value chain; and an Interactive Infographic providing a high-impact visual overview of the suite's key data points for executive briefings and stakeholder communication.
Please Note: individual reports can also be purchased separately based on your specific data needs.
Market snapshot
Global Pharmaceuticals Market Strategic Intelligence Suite snapshot, 2025–2031
 © MarketResearchReports.comDisclaimer: The actual data may vary in the final report which undergoes verification check post order confirmation.
Table of contents
01Global Pharmaceuticals Market Strategic Intelligence Suite — Overview
- Suite Introduction: The Global Pharmaceuticals Value Chain 2026–2031
- How the Two Reports Interconnect: Production vs. Consumption
- Suite Bonus Deliverables: Executive Presentation, Summary Document, and Infographic
02Report 1: Global Pharmaceuticals Industry Strategic Research Report 2026–2031 (Consumption / Demand-Side)
03Executive Summary
- 1.1 Market Scope and Research Methodology
- 1.2 Headline Market Valuation and Forecast Trajectory
- 1.3 Structural Growth Drivers
- 1.4 Regional and Country-Level Analysis
- 1.5 Competitive Landscape
- 1.6 Forecast Sensitivities and Risk Framework
- 1.7 Strategic Conclusion
04Industry Overview & Forecast
- 2.1 Market Definition and Scope
- 2.2 Headline Market Sizing and Forecast
- 2.3 Market Composition by Segment Category
- 2.4 Structural Growth Drivers
- 2.5 Segmentation by Drug Type
- 2.6 Volume Analysis
- 2.7 Segmentation by Therapy Area
- 2.8 Regional Forecast
- 2.9 Competitive Landscape and Market Concentration
- 2.10 Forecast Sensitivities and Scenario Parameters
05Market Segmentation by Type
- 3.1 Overview and Segmentation Framework
- 3.2 Small Molecule (Chemical)
- 3.3 Biologics (Monoclonal Antibodies and Recombinant Proteins)
- 3.4 Vaccines
- 3.5 Cell and Gene Therapy
- 3.6 Peptide Therapeutics
- 3.7 Oligonucleotides (siRNA and Antisense Oligonucleotides)
- 3.8 Combination, OTC and Other
- 3.9 Volume Analysis
- 3.10 Segment Synthesis and Competitive Implications
06Market Segmentation by Application
- 4.1 Overview and Methodology
- 4.2 Oncology
- 4.3 Cardio-Metabolic (Diabetes, Obesity, and Cardiovascular)
- 4.4 Immunology and Inflammation
- 4.5 Infectious Disease (Including Vaccines)
- 4.6 Neurology and Central Nervous System
- 4.7 Respiratory
- 4.8 Rare Diseases and Orphan Drugs
- 4.9 Other Applications
- 4.10 Comparative Segment Analysis and Share Dynamics
07Regional Market Forecast
- North America
- Europe
- Asia-Pacific
- Latin America
- Middle East & Africa
08Country-Level Market Forecast
- 6.1 North America
- 6.1.1 United States
- 6.1.2 Canada
- 6.1.3 Rest of North America
- 6.2 Europe
- 6.2.1 Germany
- 6.2.2 France
- 6.2.3 United Kingdom
- 6.2.4 Italy
- 6.2.5 Spain
- 6.2.6 Russia
- 6.2.7 Switzerland
- 6.2.8 Netherlands
- 6.2.9 Belgium
- 6.2.10 Turkey
- 6.2.11 Rest of Europe
- 6.3 Asia-Pacific
- 6.4 Latin America
- 6.5 Middle East & Africa
09Growth Drivers & Inhibitors
- 7.1 Growth Drivers
- 7.2 Market Inhibitors
- 7.3 Integrated Assessment
10Key Company Profiles
- 8.1 Johnson & Johnson
- 8.1.1 Company Overview
- 8.1.2 Key Products & Segments
- 8.1.3 Financial Performance (2023–2025)
- 8.1.4 Business Strategy
- 8.1.5 SWOT Analysis
- 8.1.6 Strategic Implications (2025–2031)
- 8.2 Pfizer
- 8.2.1 Company Overview
- 8.2.2 Key Products & Segments
- 8.2.3 Financial Performance (2023–2025)
- 8.2.4 Business Strategy
- 8.2.5 SWOT Analysis
- 8.2.6 Strategic Implications (2025–2031)
- 8.3 Roche (Pharma Div.)
- 8.3.1 Company Overview
- 8.3.2 Key Products & Segments
- 8.3.3 Financial Performance (2023–2025)
- 8.3.4 Business Strategy
- 8.3.5 SWOT Analysis
- 8.3.6 Strategic Implications (2025–2031)
- 8.4 Merck & Co. (MSD)
- 8.4.1 Company Overview
- 8.4.2 Key Products & Segments
- 8.4.3 Financial Performance (2023–2025)
- 8.4.4 Business Strategy
- 8.4.5 SWOT Analysis
- 8.4.6 Strategic Implications (2025–2031)
- 8.5 AbbVie
- 8.5.1 Company Overview
- 8.5.2 Key Products & Segments
- 8.5.3 Financial Performance (2023–2025)
- 8.5.4 Business Strategy
- 8.5.5 SWOT Analysis
- 8.5.6 Strategic Implications (2025–2031)
- 8.6 Novartis
- 8.6.1 Company Overview
- 8.6.2 Key Products & Segments
- 8.6.3 Financial Performance (2023–2025)
- 8.6.4 Business Strategy
- 8.6.5 SWOT Analysis
- 8.6.6 Strategic Implications (2025–2031)
- 8.7 AstraZeneca
- 8.7.1 Company Overview
- 8.7.2 Key Products & Segments
- 8.7.3 Financial Performance (2023–2025)
- 8.7.4 Business Strategy
- 8.7.5 SWOT Analysis
- 8.7.6 Strategic Implications (2025–2031)
- 8.8 Sanofi
- 8.8.1 Company Overview
- 8.8.2 Key Products & Segments
- 8.8.3 Financial Performance (2023–2025)
- 8.8.4 Business Strategy
- 8.8.5 SWOT Analysis
- 8.8.6 Strategic Implications (2025–2031)
- 8.9 Bristol-Myers Squibb
- 8.9.1 Company Overview
- 8.9.2 Key Products & Segments
- 8.9.3 Financial Performance (2023–2025)
- 8.9.4 Business Strategy
- 8.9.5 SWOT Analysis
- 8.9.6 Strategic Implications (2025–2031)
- 8.10 Eli Lilly
- 8.10.1 Company Overview
- 8.10.2 Key Products & Segments
- 8.10.3 Financial Performance (2023–2025)
- 8.10.4 Business Strategy
- 8.10.5 SWOT Analysis
- 8.10.6 Strategic Implications (2025–2031)
- 8.11 GSK
- 8.11.1 Company Overview
- 8.11.2 Key Products & Segments
- 8.11.3 Financial Performance (2023–2025)
- 8.11.4 Business Strategy
- 8.11.5 SWOT Analysis
- 8.11.6 Strategic Implications (2025–2031)
- 8.12 Novo Nordisk
- 8.12.1 Company Overview
- 8.12.2 Key Products & Segments
- 8.12.3 Financial Performance (2023–2025)
- 8.12.4 Business Strategy
- 8.12.5 SWOT Analysis
- 8.12.6 Strategic Implications (2025–2031)
- 8.13 Takeda
- 8.13.1 Company Overview
- 8.13.2 Key Products & Segments
- 8.13.3 Financial Performance (2023–2025)
- 8.13.4 Business Strategy
- 8.13.5 SWOT Analysis
- 8.13.6 Strategic Implications (2025–2031)
- 8.14 Bayer (Pharma Div.)
- 8.14.1 Company Overview
- 8.14.2 Key Products & Segments
- 8.14.3 Financial Performance (2023–2025)
- 8.14.4 Business Strategy
- 8.14.5 SWOT Analysis
- 8.14.6 Strategic Implications (2025–2031)
- 8.15 Boehringer Ingelheim
- 8.15.1 Company Overview
- 8.15.2 Key Products & Segments
- 8.15.3 Financial Performance (2023–2025)
- 8.15.4 Business Strategy
- 8.15.5 SWOT Analysis
- 8.15.6 Strategic Implications (2025–2031)
- 8.16 Amgen
- 8.16.1 Company Overview
- 8.16.2 Key Products & Segments
- 8.16.3 Financial Performance (2023–2025)
- 8.16.4 Business Strategy
- 8.16.5 SWOT Analysis
- 8.16.6 Strategic Implications (2025–2031)
- 8.17 Gilead Sciences
- 8.17.1 Company Overview
- 8.17.2 Key Products & Segments
- 8.17.3 Financial Performance (2023–2025)
- 8.17.4 Business Strategy
- 8.17.5 SWOT Analysis
- 8.17.6 Strategic Implications (2025–2031)
- 8.18 Vertex Pharma
- 8.18.1 Company Overview
- 8.18.2 Key Products & Segments
- 8.18.3 Financial Performance (2023–2025)
- 8.18.4 Business Strategy
- 8.18.5 SWOT Analysis
- 8.18.6 Strategic Implications (2025–2031)
- 8.19 Regeneron
- 8.19.1 Company Overview
- 8.19.2 Key Products & Segments
- 8.19.3 Financial Performance (2023–2025)
- 8.19.4 Business Strategy
- 8.19.5 SWOT Analysis
- 8.19.6 Strategic Implications (2025–2031)
- 8.20 Biogen
- 8.20.1 Company Overview
- 8.20.2 Key Products & Segments
- 8.20.3 Financial Performance (2023–2025)
- 8.20.4 Business Strategy
- 8.20.5 SWOT Analysis
- 8.20.6 Strategic Implications (2025–2031)
- 8.21 Moderna
- 8.21.1 Company Overview
- 8.21.2 Key Products & Segments
- 8.21.3 Financial Performance (2023–2025)
- 8.21.4 Business Strategy
- 8.21.5 SWOT Analysis
- 8.21.6 Strategic Implications (2025–2031)
- 8.22 Teva Pharma
- 8.22.1 Company Overview
- 8.22.2 Key Products & Segments
- 8.22.3 Financial Performance (2023–2025)
- 8.22.4 Business Strategy
- 8.22.5 SWOT Analysis
- 8.22.6 Strategic Implications (2025–2031)
- 8.23 Viatris
- 8.23.1 Company Overview
- 8.23.2 Key Products & Segments
- 8.23.3 Financial Performance (2023–2025)
- 8.23.4 Business Strategy
- 8.23.5 SWOT Analysis
- 8.23.6 Strategic Implications (2025–2031)
- 8.24 Sun Pharma
- 8.24.1 Company Overview
- 8.24.2 Key Products & Segments
- 8.24.3 Financial Performance (2023–2025)
- 8.24.4 Business Strategy
- 8.24.5 SWOT Analysis
- 8.24.6 Strategic Implications (2025–2031)
- 8.25 Dr. Reddy's Labs
- 8.25.1 Company Overview
- 8.25.2 Key Products & Segments
- 8.25.3 Financial Performance (2023–2025)
- 8.25.4 Business Strategy
- 8.25.5 SWOT Analysis
- 8.25.6 Strategic Implications (2025–2031)
11Competitive Landscape
- 9.1 Competitive Landscape Overview
- 9.2 Competitive Intensity Assessment
- 9.3 Key Player Strategies & Positioning
- 9.4 Competitive Dynamics & Strategic Outlook
12Porter's Five Forces Analysis
- 10.1 Threat of New Entrants
- 10.2 Bargaining Power of Buyers
- 10.3 Bargaining Power of Suppliers
- 10.4 Threat of Substitutes
- 10.5 Competitive Rivalry
13PESTLE Analysis
- 11.1 Political
- 11.2 Economic
- 11.3 Social
- 11.4 Technological
- 11.5 Legal
- 11.6 Environmental
14SWOT Analysis
- 12.1 Strengths
- 12.2 Weaknesses
- 12.3 Opportunities
- 12.4 Threats
15Future Trends & Outlook
- 13.1 Structural Context
- 13.2 Key Trends
- 13.3 Strategic Outlook
16Report 2: Global Pharmaceuticals Manufacturing Market Strategic Research Report 2026–2031 (Production / Supply-Side)
17Executive Summary
- 1.1 Report Overview
- 1.2 Production Scale & Growth Trajectory
- 1.3 Country Concentration & Net Export Dynamics
- 1.4 Segment Composition & Mix Shift
- 1.5 Capital Expenditure Cycle
- 1.6 Key Findings Summary
18Industry Overview & Forecast
- 2.1 Global Pharmaceutical Manufacturing Market — Scale, Trajectory, and Structural Composition
- 2.1.1 Market Scale and Historical Baseline
- 2.1.2 Forecast Period Acceleration
- 2.1.3 Production vs. Consumption Gap — Structural Divergence
- 2.1.4 Segment Composition and the Ongoing Mix Shift
- 2.1.5 Production by Geography — Regional Overview
- 2.1.6 Capital Expenditure — The Defining Investment Cycle
- 2.1.7 Leading Manufacturers — Real 2025 Anchors
- 2.1.8 Key Quantitative Summary
19Market Segmentation by Type
- 3.1 Overview of Segment Architecture
- 3.2 Small-Molecule Formulation
- 3.3 Active Pharmaceutical Ingredient (API) Manufacturing
- 3.4 Biologics Manufacturing (Monoclonal Antibodies and Proteins)
- 3.5 Vaccines Production
- 3.6 Cell and Gene Therapy Manufacturing
- 3.7 Peptide Synthesis and Fill-Finish (GLP-1-Driven)
- 3.8 OTC, Oligonucleotides, and Value-Added Manufacturing (Reconciling Segment)ing Segment)
- 3.9 Segment Mix Shift: The Structural Rebalancing Through 2031
20Market Segmentation by Application
- 4.1 Overview of Segment Architecture
- 4.2 Active Pharmaceutical Ingredient Manufacturing
- 4.2.1 Segment Scale and Historical Trajectory
- 4.2.2 Forecast and Growth Drivers
- 4.3 Small-Molecule Formulation Manufacturing
- 4.3.1 Segment Scale and Position
- 4.3.2 Forecast and Structural Trajectory
- 4.4 Biologics Manufacturing
- 4.4.1 Strategic Importance and 2025 Baseline
- 4.4.2 Forecast: Crossing 42 Percent Share by 2031
- 4.5 Vaccines Production
- 4.5.1 Post-COVID Normalisation and Structural Re-anchoring
- 4.5.2 Recovery Forecast
- 4.6 Cell and Gene Therapy Manufacturing
- 4.6.1 The Fastest-Growing Industrial Segment Globally
- 4.7 Peptide Synthesis and Fill-Finish
- 4.7.1 The Single Fastest-Growing Large Segment
- 4.7.2 Forecast Through 2031
- 4.8 OTC, Oligonucleotides, and Value-Add Reconciling Segment
- 4.8.1 Role and Decline Trajectory
- 4.9 Segment Mix Shift
- 4.9.1 Quantifying the Structural Transition
- 4.9.2 Capital Expenditure as a Leading Indicator
21Regional Market Forecast
- North America
- Europe
- Asia Pacific
- Latin America
- MEA
22Country-Level Market Forecast
- 6.1 North America
- 6.1.1 United States
- 6.1.2 Puerto Rico (US)
- 6.1.3 Canada
- 6.1.4 Rest of North America
- 6.2 Europe
- 6.2.1 Switzerland
- 6.2.2 Ireland
- 6.2.3 Germany
- 6.2.4 France
- 6.2.5 United Kingdom
- 6.2.6 Italy
- 6.2.7 Belgium
- 6.2.8 Denmark
- 6.2.9 Netherlands
- 6.2.10 Spain
- 6.2.11 Russia
- 6.2.12 Rest of Europe
23Growth Drivers & Inhibitors
- 7.1 Growth Drivers
- 7.2 Market Inhibitors
- 7.3 Integrated Assessment
24Key Company Profiles
- 8.1 Johnson & Johnson
- 8.1.1 Company Overview
- 8.1.2 Key Products & Segments
- 8.1.3 Financial Performance (2023–2025)
- 8.1.4 Business Strategy
- 8.1.5 SWOT Analysis
- 8.1.6 Strategic Implications (2025–2031)
- 8.2 Eli Lilly
- 8.2.1 Company Overview
- 8.2.2 Key Products & Segments
- 8.2.3 Financial Performance (2023–2025)
- 8.2.4 Business Strategy
- 8.2.5 SWOT Analysis
- 8.2.6 Strategic Implications (2025–2031)
- 8.3 Merck & Co. (MSD)
- 8.3.1 Company Overview
- 8.3.2 Key Products & Segments
- 8.3.3 Financial Performance (2023–2025)
- 8.3.4 Business Strategy
- 8.3.5 SWOT Analysis
- 8.3.6 Strategic Implications (2025–2031)
- 8.4 Pfizer
- 8.4.1 Company Overview
- 8.4.2 Key Products & Segments
- 8.4.3 Financial Performance (2023–2025)
- 8.4.4 Business Strategy
- 8.4.5 SWOT Analysis
- 8.4.6 Strategic Implications (2025–2031)
- 8.5 AbbVie
- 8.5.1 Company Overview
- 8.5.2 Key Products & Segments
- 8.5.3 Financial Performance (2023–2025)
- 8.5.4 Business Strategy
- 8.5.5 SWOT Analysis
- 8.5.6 Strategic Implications (2025–2031)
- 8.6 Roche (Pharmaceuticals Division)
- 8.6.1 Company Overview
- 8.6.2 Key Products & Segments
- 8.6.3 Financial Performance (2023–2025)
- 8.6.4 Business Strategy
- 8.6.5 SWOT Analysis
- 8.6.6 Strategic Implications (2025–2031)
- 8.7 AstraZeneca
- 8.7.1 Company Overview
- 8.7.2 Key Products & Segments
- 8.7.3 Financial Performance (2023–2025)
- 8.7.4 Business Strategy
- 8.7.5 SWOT Analysis
- 8.7.6 Strategic Implications (2025–2031)
- 8.8 Novartis
- 8.8.1 Company Overview
- 8.8.2 Key Products & Segments
- 8.8.3 Financial Performance (2023–2025)
- 8.8.4 Business Strategy
- 8.8.5 SWOT Analysis
- 8.8.6 Strategic Implications (2025–2031)
- 8.9 Sanofi
- 8.9.1 Company Overview
- 8.9.2 Key Products & Segments
- 8.9.3 Financial Performance (2023–2025)
- 8.9.4 Business Strategy
- 8.9.5 SWOT Analysis
- 8.9.6 Strategic Implications (2025–2031)
- 8.10 Bristol-Myers Squibb
- 8.10.1 Company Overview
- 8.10.2 Key Products & Segments
- 8.10.3 Financial Performance (2023–2025)
- 8.10.4 Business Strategy
- 8.10.5 SWOT Analysis
- 8.10.6 Strategic Implications (2025–2031)
- 8.11 GSK
- 8.11.1 Company Overview
- 8.11.2 Key Products & Segments
- 8.11.3 Financial Performance (2023–2025)
- 8.11.4 Business Strategy
- 8.11.5 SWOT Analysis
- 8.11.6 Strategic Implications (2025–2031)
- 8.12 Novo Nordisk
- 8.12.1 Company Overview
- 8.12.2 Key Products & Segments
- 8.12.3 Financial Performance (2023–2025)
- 8.12.4 Business Strategy
- 8.12.5 SWOT Analysis
- 8.12.6 Strategic Implications (2025–2031)
- 8.13 Takeda
- 8.13.1 Company Overview
- 8.13.2 Key Products & Segments
- 8.13.3 Financial Performance (2023–2025)
- 8.13.4 Business Strategy
- 8.13.5 SWOT Analysis
- 8.13.6 Strategic Implications (2025–2031)
- 8.14 Bayer (Pharmaceuticals Division)
- 8.14.1 Company Overview
- 8.14.2 Key Products & Segments
- 8.14.3 Financial Performance (2023–2025)
- 8.14.4 Business Strategy
- 8.14.5 SWOT Analysis
- 8.14.6 Strategic Implications (2025–2031)
- 8.15 Boehringer Ingelheim
- 8.15.1 Company Overview
- 8.15.2 Key Products & Segments
- 8.15.3 Financial Performance (2023–2025)
- 8.15.4 Business Strategy
- 8.15.5 SWOT Analysis
- 8.15.6 Strategic Implications (2025–2031)
- 8.16 Amgen
- 8.16.1 Company Overview
- 8.16.2 Key Products & Segments
- 8.16.3 Financial Performance (2023–2025)
- 8.16.4 Business Strategy
- 8.16.5 SWOT Analysis
- 8.16.6 Strategic Implications (2025–2031)
- 8.17 Gilead Sciences
- 8.17.1 Company Overview
- 8.17.2 Key Products & Segments
- 8.17.3 Financial Performance (2023–2025)
- 8.17.4 Business Strategy
- 8.17.5 SWOT Analysis
- 8.17.6 Strategic Implications (2025–2031)
- 8.18 Vertex Pharmaceuticals
- 8.18.1 Company Overview
- 8.18.2 Key Products & Segments
- 8.18.3 Financial Performance (2023–2025)
- 8.18.4 Business Strategy
- 8.18.5 SWOT Analysis
- 8.18.6 Strategic Implications (2025–2031)
- 8.19 Regeneron Pharmaceuticals
- 8.19.1 Company Overview
- 8.19.2 Key Products & Segments
- 8.19.3 Financial Performance (2023–2025)
- 8.19.4 Business Strategy
- 8.19.5 SWOT Analysis
- 8.19.6 Strategic Implications (2025–2031)
- 8.20 Biogen
- 8.20.1 Company Overview
- 8.20.2 Key Products & Segments
- 8.20.3 Financial Performance (2023–2025)
- 8.20.4 Business Strategy
- 8.20.5 SWOT Analysis
- 8.20.6 Strategic Implications (2025–2031)
- 8.21 Moderna
- 8.21.1 Company Overview
- 8.21.2 Key Products & Segments
- 8.21.3 Financial Performance (2023–2025)
- 8.21.4 Business Strategy
- 8.21.5 SWOT Analysis
- 8.21.6 Strategic Implications (2025–2031)
- 8.22 Teva Pharmaceutical Industries
- 8.22.1 Company Overview
- 8.22.2 Key Products & Segments
- 8.22.3 Financial Performance (2023–2025)
- 8.22.4 Business Strategy
- 8.22.5 SWOT Analysis
- 8.22.6 Strategic Implications (2025–2031)
- 8.23 Viatris
- 8.23.1 Company Overview
- 8.23.2 Key Products & Segments
- 8.23.3 Financial Performance (2023–2025)
- 8.23.4 Business Strategy
- 8.23.5 SWOT Analysis
- 8.23.6 Strategic Implications (2025–2031)
- 8.24 Sun Pharmaceutical Industries
- 8.24.1 Company Overview
- 8.24.2 Key Products & Segments
- 8.24.3 Financial Performance (2023–2025)
- 8.24.4 Business Strategy
- 8.24.5 SWOT Analysis
- 8.24.6 Strategic Implications (2025–2031)
- 8.25 Dr. Reddy's Laboratories
- 8.25.1 Company Overview
- 8.25.2 Key Products & Segments
- 8.25.3 Financial Performance (2023–2025)
- 8.25.4 Business Strategy
- 8.25.5 SWOT Analysis
- 8.25.6 Strategic Implications (2025–2031)
- 8.26 Samsung Biologics
- 8.26.1 Company Overview
- 8.26.2 Key Products & Segments
- 8.26.3 Financial Performance (2023–2025)
- 8.26.4 Business Strategy
- 8.26.5 SWOT Analysis
- 8.26.6 Strategic Implications (2025–2031)
- 8.27 Lonza
- 8.27.1 Company Overview
- 8.27.2 Key Products & Segments
- 8.27.3 Financial Performance (2023–2025)
- 8.27.4 Business Strategy
- 8.27.5 SWOT Analysis
- 8.27.6 Strategic Implications (2025–2031)
- 8.28 WuXi Biologics
- 8.28.1 Company Overview
- 8.28.2 Key Products & Segments
- 8.28.3 Financial Performance (2023–2025)
- 8.28.4 Business Strategy
- 8.28.5 SWOT Analysis
- 8.28.6 Strategic Implications (2025–2031)
- 8.29 Catalent (Novo Holdings)
- 8.29.1 Company Overview
- 8.29.2 Key Products & Segments
- 8.29.3 Financial Performance (2023–2025)
- 8.29.4 Business Strategy
- 8.29.5 SWOT Analysis
- 8.29.6 Strategic Implications (2025–2031)
25Competitive Landscape (Manufacturing Perspective)
- 9.1 Competitive Landscape Overview
- 9.2 Market Share Analysis
- 9.3 Key Player Strategies & Positioning
26Porter's Five Forces Analysis -- Pharmaceutical Manufacturing
- 10.1 Threat of New Entrants -- Detailed Analysis
- 10.2 Bargaining Power of Buyers
- 10.3 Bargaining Power of Suppliers
- 10.4 Threat of Substitutes
- 10.5 Competitive Rivalry
27PESTLE Analysis -- Pharmaceutical Manufacturing
- 11.1 Political
- 11.2 Economic
- 11.3 Social
- 11.4 Technological
- 11.5 Legal
- 11.6 Environmental
28SWOT Analysis -- Global Pharmaceutical Manufacturing Industry
- 12.1 Strengths
- 12.2 Weaknesses
- 12.3 Opportunities
- 12.4 Threats
29Manufacturing Growth Drivers and Inhibitors
- 13.1 Structural Drivers
- 13.2 Structural Inhibitors
30Future Trends in Pharmaceutical Manufacturing Through 2031
- 14.1 Key Trends
- 14.2 Strategic Outlook
31Conclusion and Strategic Implications
- 15.1 Summary of Findings
- 15.2 Strategic Implications for Innovator Manufacturers
- 15.3 Strategic Implications for CDMOs
- 15.4 Strategic Implications for Governments
- 15.5 Strategic Implications for Investors
- 15.6 Forecast Assumption Summary
32Suite Bonus Deliverables
- Executive Presentation — A 10-slide cross-report visual summary synthesising key findings, market sizes, growth rates, regional dynamics, and the production-consumption linkage across both reports.
- Cross-Report Summary Document — A structured summary explaining how the Manufacturing and Industry reports interconnect across the pharmaceutical value chain, with a publisher's methodology note.
- Interactive Infographic — A high-impact visual infographic presenting the key headline data from both markets for executive briefings and stakeholder communication.
Frequently asked questions
What is included in the Global Pharmaceuticals Market Strategic Intelligence Suite?
What is the combined market size covered by this suite?
Why does production exceed consumption, and why does it grow faster?
How many companies are covered across the suite?
Can I purchase the individual reports separately?
Research Methodology
All MarketResearchReports.com strategic research reports follow a rigorous, multi-stage methodology combining AI-assisted data synthesis with expert analyst validation.
Systematic collection from 500+ verified sources including SEC filings, industry databases (Bloomberg, Statista, OECD), regulatory filings, trade publications, patent databases, and company annual reports. AI-assisted extraction identifies relevant data points across 10,000+ documents per report.
Dual-validation approach: bottom-up sizing aggregates segment-level production, consumption, and trade data; top-down sizing cross-validates against macroeconomic indicators and total addressable market estimates. Discrepancies >5% trigger analyst review.
Company profiles built from public financial disclosures, product launches, M&A activity, job postings (as capability proxies), and supply chain mapping. Market share estimates triangulated across revenue, capacity, and shipment data.
CAGR projections use time-series regression on 5-10 years of historical data, adjusted for identified demand drivers (technology adoption curves, regulatory catalysts, demographic shifts) and demand inhibitors (cost barriers, substitution risk). Scenario modeling covers base, optimistic, and conservative cases.
All quantitative outputs reviewed by a domain-specialist analyst before publication. Data triangulation requires minimum 3 independent sources for every key figure. Reports undergo a structured peer review against our 47-point quality checklist covering methodology, data citations, logical consistency, and formatting standards.
On-demand reports are generated at time of purchase, incorporating the most recent available data. Static reports are republished when underlying market conditions shift by >10% from baseline assumptions. Purchasers receive update notifications for 12 months.
Related reports
 Navadhi Market Research · Pharmaceuticals
Global Peptide Market Strategic Intelligence Suite
The Global Peptide Market Strategic Intelligence Suite 2026–2031 is Navadhi Market Research's most comprehensive intelligence offering on the global peptide industry…
Navadhi Market Research · PharmaceuticalsGlobal Oncology Market Strategic Research Report
The global oncology market is undergoing a historic structural transformation driven by three simultaneous pharmaceutical supercycles - the immunotherapy/checkpoint …
Navadhi Market Research · PharmaceuticalsGlobal Peptide Therapy Market Strategic Research Report
The global peptide therapy market is undergoing an unprecedented structural transformation driven by the GLP-1 revolution - the extraordinary commercial success of G…
Need a customized version?
Get country-, segment- or company-specific intelligence tailored to your exact requirements.
Request custom research →Request a free sample
Receive a sample of Global Pharmaceuticals Market Strategic Intelligence Suite before you buy.
Customize This Report
Describe your specific requirements and our analysts will scope and deliver a tailored version.
Request Invoice
We will email a proforma invoice within 24 hours. Report access is granted upon payment confirmation.
Leading Brands in This Industry





