


12 Market Research Methods: When to Use Each One

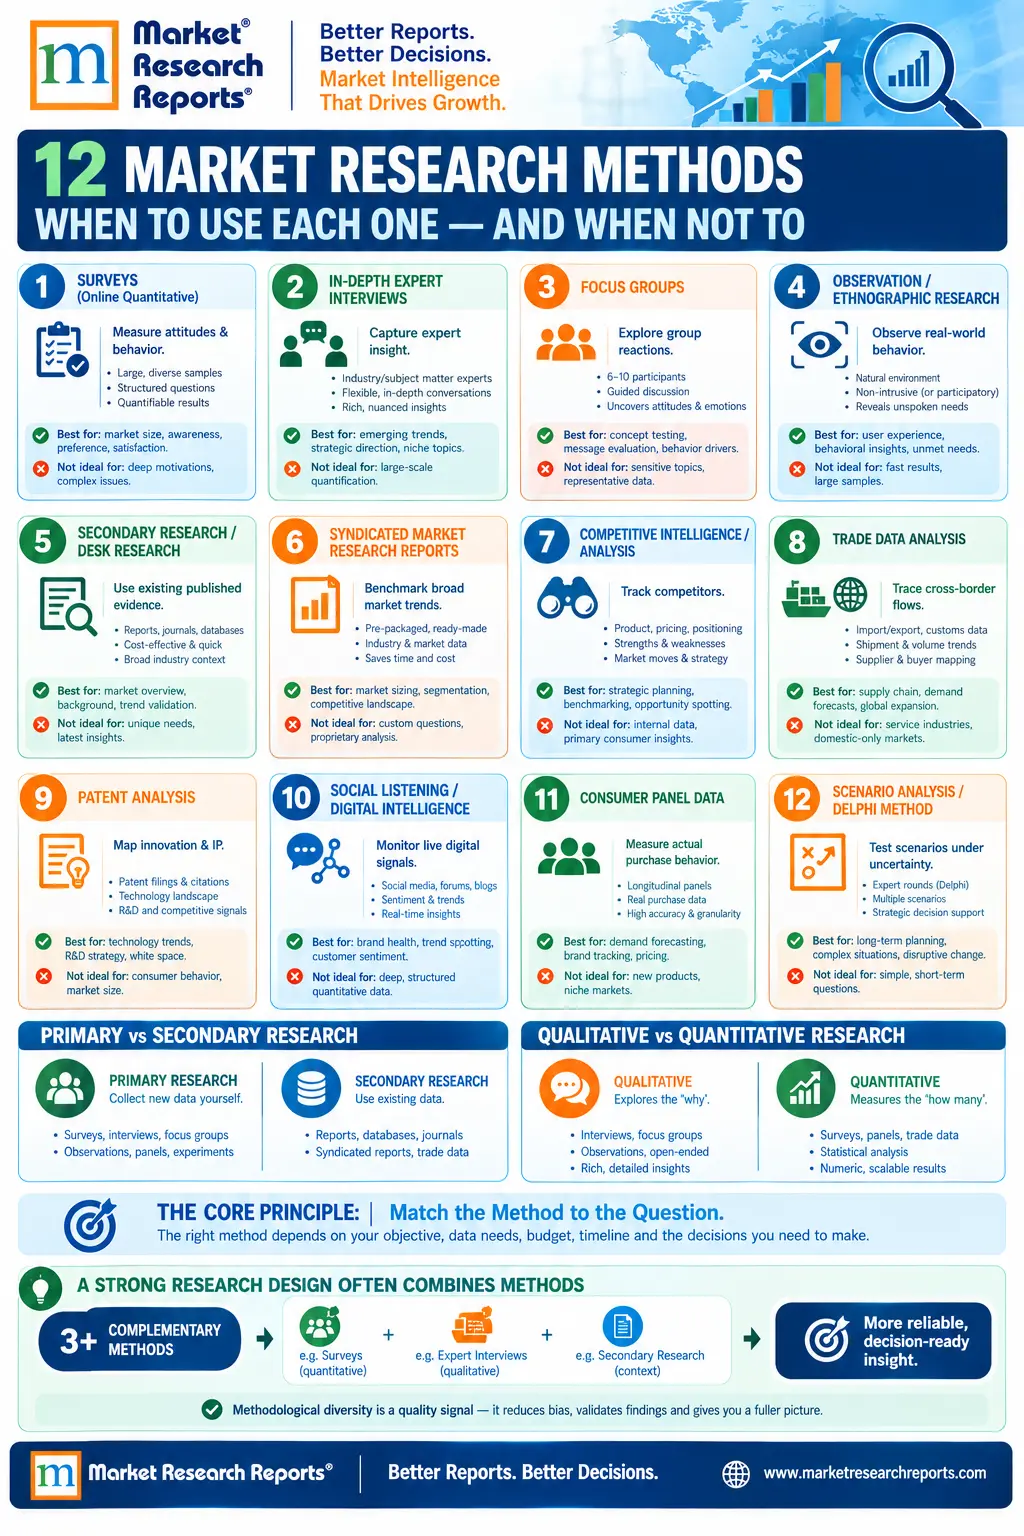
The method determines the insight. Choosing the wrong research method for a question does not just produce incomplete data - it produces confidently wrong data that can survive unchallenged into strategic decisions. Understanding the range of market research methods, when each is appropriate, and where each falls short is a practical skill for anyone commissioning or using market intelligence.
What are market research methods?
Market research methods are the specific techniques used to collect, validate, and analyse market intelligence. They fall into two primary categories: primary research (original data collection from market participants) and secondary research (analysis of data that already exists in published sources). Within each category, different methods serve different questions - and the choice of method is as analytically consequential as the quality of execution.
Most high-quality professional research engagements use multiple methods in combination, using each to validate and supplement the others. A market sizing estimate derived solely from secondary sources should be tested against primary research with industry participants. Primary survey data on customer intent should be contextualised against secondary data on actual market behaviour. Methodological diversity is a quality signal, not a cost inefficiency.
1. Online surveys
What it is: Structured questionnaires administered to a defined sample of respondents via digital channels. Surveys collect quantitative data at scale - purchase intent, price sensitivity, brand awareness, usage patterns, demographic distributions.
Best for: Consumer preference research, B2B buyer behaviour studies, market penetration measurement, NPS and satisfaction tracking, and any question where a statistically representative sample is needed to support a quantitative claim.
Limitations: Survey data reflects what respondents say they do, not necessarily what they do. Social desirability bias (respondents answering as they think they should rather than as they actually behave) and recall bias (inaccurate recollection of past behaviour) are persistent challenges. Sample composition and question framing have a material effect on results. Professional survey design and sample quality control are not optional extras - they are the difference between reliable data and misleading data.
2. In-depth expert interviews
What it is: Structured or semi-structured one-on-one conversations with individuals who have direct, substantive knowledge of the market being studied - industry executives, technical specialists, supply chain participants, regulatory experts, or customers with deep purchasing experience.
Best for: Validating secondary data against current market reality, understanding competitive dynamics in markets with limited public disclosure, capturing expert judgment on market trajectories that no published source has yet described, and building contextual understanding that makes quantitative data interpretable.
Limitations: Individual expert views are influenced by their specific organisational vantage point. An executive at a large incumbent will describe market dynamics differently from a startup founder in the same market. A minimum of 8–12 expert conversations across different types of market participants is required to form a reliable picture. Fewer than that and the "expert interviews" section of a methodology is anecdote, not research.
3. Focus groups
What it is: Structured discussion sessions with 6–10 participants from a defined target population, facilitated to explore attitudes, perceptions, and motivations around a product, service, or market.
Best for: Exploratory research at the early stages of a product development or market entry process; generating hypotheses for quantitative testing; understanding the language and framing that target customers use to describe their needs and preferences.
Limitations: Focus groups are vulnerable to group dynamics - a dominant participant, a facilitator who inadvertently signals preferred responses, or a socially uncomfortable topic will skew results. They produce qualitative insight, not statistical data. They should generate hypotheses for quantitative research, not replace it.
4. Observation and ethnographic research
What it is: Direct observation of market participants in their natural context - customers in a retail environment, workers using industrial equipment, patients navigating a healthcare setting - to understand behaviour as it actually occurs rather than as participants report it.
Best for: Identifying usage patterns that customers do not consciously register and therefore cannot report in surveys; uncovering problems and workarounds that users have normalised; informing product design with behavioural data rather than stated preferences.
Limitations: Observation is time-intensive and contextually bounded - it captures behaviour in the specific settings studied, which may not generalise. It is most valuable as a complement to survey data, providing the behavioural grounding for attitudes that surveys measure.
5. Secondary research and desk research
What it is: Systematic review and analysis of existing published sources - government databases, trade association reports, company filings, academic journals, patent databases, news archives - to extract and synthesise relevant market data.
Best for: Establishing market context and baseline data; building a market sizing model from public sources; understanding the competitive landscape from disclosed information; and providing the framework within which primary research findings are interpreted.
Limitations: Secondary research can only describe what has been publicly disclosed. Markets with limited public disclosure (private company-dominated industries, markets in geographies with limited statistical infrastructure, emerging technology segments) cannot be adequately characterised by secondary research alone. Secondary data is also inevitably historical - it reflects market conditions at the time of publication, not necessarily current reality.
6. Syndicated market research reports
What it is: Pre-produced market intelligence reports covering defined markets, available for purchase from market research firms and accessible immediately on purchase. Syndicated reports combine secondary research with primary validation to produce a validated, formatted intelligence deliverable.
Best for: Time-efficient market orientation; obtaining citable, third-party market size and CAGR data for presentations and board materials; competitive landscape overviews; and monitoring established markets without commissioning bespoke research.
Limitations: Syndicated reports are designed for a broad audience and therefore cover markets at a level of aggregation that may be too general for specific strategic questions. They reflect conditions at the time of publication and may be 6–18 months behind current market reality. They are not proprietary - the same report is available to your competitors.
7. Competitive intelligence and analysis
What it is: Systematic collection and analysis of information about competitors - their products, pricing, market positioning, customer relationships, financial performance, and strategic direction - from public and primary sources.
Best for: Informing competitive strategy, identifying competitive vulnerabilities and opportunities, monitoring competitor activity, and building the competitive landscape section of market research deliverables.
Limitations: Competitive intelligence from public sources is necessarily limited to what competitors choose to disclose. Primary competitive intelligence (from competitor customers, former employees, or industry observers) provides depth but requires careful attention to ethical and legal boundaries.
8. Trade data analysis
What it is: Analysis of import and export data from customs authorities, supplemented by trade association shipment statistics, to quantify market flows at a product and geography level.
Best for: Sizing markets where production or consumption data is not directly available; understanding supply chain geographies; tracking market share for traded physical goods where customs data covers most transactions.
Limitations: Trade data uses harmonised system (HS) codes that may aggregate multiple product categories, making it difficult to isolate specific sub-markets. Services markets are not captured in trade data. Data timeliness varies significantly by country.
9. Patent analysis
What it is: Systematic analysis of patent filings - volume, geography, technology classification, filing entity - as a leading indicator of technology development activity and competitive investment in innovation.
Best for: Technology markets where R&D investment precedes commercial product availability; competitive intelligence on innovation direction; identifying emerging technology players before they appear in commercial market data.
Limitations: Not all R&D investment results in patents; not all patents result in commercial products. Patent data is a leading indicator of technology direction, not a reliable predictor of commercial market outcomes.
10. Social listening and digital intelligence
What it is: Analysis of publicly available digital signals - social media conversation, search volume trends, online review sentiment, web traffic data - to infer market interest, brand perception, and emerging demand patterns.
Best for: Consumer market research where digital engagement is high; early detection of emerging trends before they appear in traditional market data; brand perception monitoring; and competitive benchmarking on digital presence.
Limitations: Digital signals reflect the online population, which is not representative of all markets. B2B markets and offline consumer behaviours are underrepresented. Volume of digital conversation correlates with interest but not necessarily with commercial intent.
11. Consumer panel data
What it is: Longitudinal data collected from a standing panel of consumers who record their actual purchasing behaviour over time - what they buy, where, how often, and at what price.
Best for: Consumer goods markets where actual purchase behaviour (rather than stated intent) is the key metric; market share tracking; promotion effectiveness measurement; and segmentation of purchasing patterns.
Limitations: Panel data is expensive and is primarily available for consumer goods categories with high purchase frequency. B2B markets, durable goods, and services markets are not well-served by panel data.
12. Scenario analysis and Delphi method
What it is: Scenario analysis constructs multiple coherent future states for a market based on different assumptions about key variables. The Delphi method is a structured expert consultation process that converges on a consensus forecast through iterative rounds of expert input and feedback.
Best for: Markets with high uncertainty over the forecast horizon; strategic planning that requires stress-testing against multiple possible futures; and emerging technology markets where no consensus data exists.
Limitations: Scenario analysis is only as valuable as the quality of the underlying assumptions. Expert consensus via Delphi reflects collective expert judgment, not empirical data - it can be wrong, particularly at technology inflection points where the pace of change exceeds expert experience.
The principle: method diversity as a quality standard
Most professional research engagements that produce reliable intelligence use at least three methods in combination - typically secondary research as the foundation, primary expert interviews to validate and supplement, and quantitative primary research (survey or panel) where behavioural data is required. The combination provides internal validation: findings that hold across multiple independent methods are more reliable than findings from any single method.
See our research methodology page for how these methods are applied in our own research process. To discuss which methods are appropriate for your specific research question, contact our custom research team.