


Global Pharmaceutical Production vs Consumption Analysis - Understanding the Global Pharmaceutical Demand-Supply Value Chain
MRR® Industry Intelligence Briefing Pharmaceuticals · Supply Chain · Market Methodology
A tablet sitting in a pharmacy in Ohio likely started as a chemical reaction in a facility in Shandong province. The active ingredient it depends on was probably synthesized further in Hyderabad or Ahmedabad. The tablet itself was pressed, coated, and packaged somewhere in that same Indian facility, or one much like it. By the time a patient swallows it, that single pill has crossed at least two international borders and passed through the hands of manufacturers whose combined revenue rarely shows up in the same market report as the price the patient actually paid. That gap - between where a drug is made and where it is consumed - is not a footnote in the pharmaceutical industry. It is close to the whole story.
Executive Summary
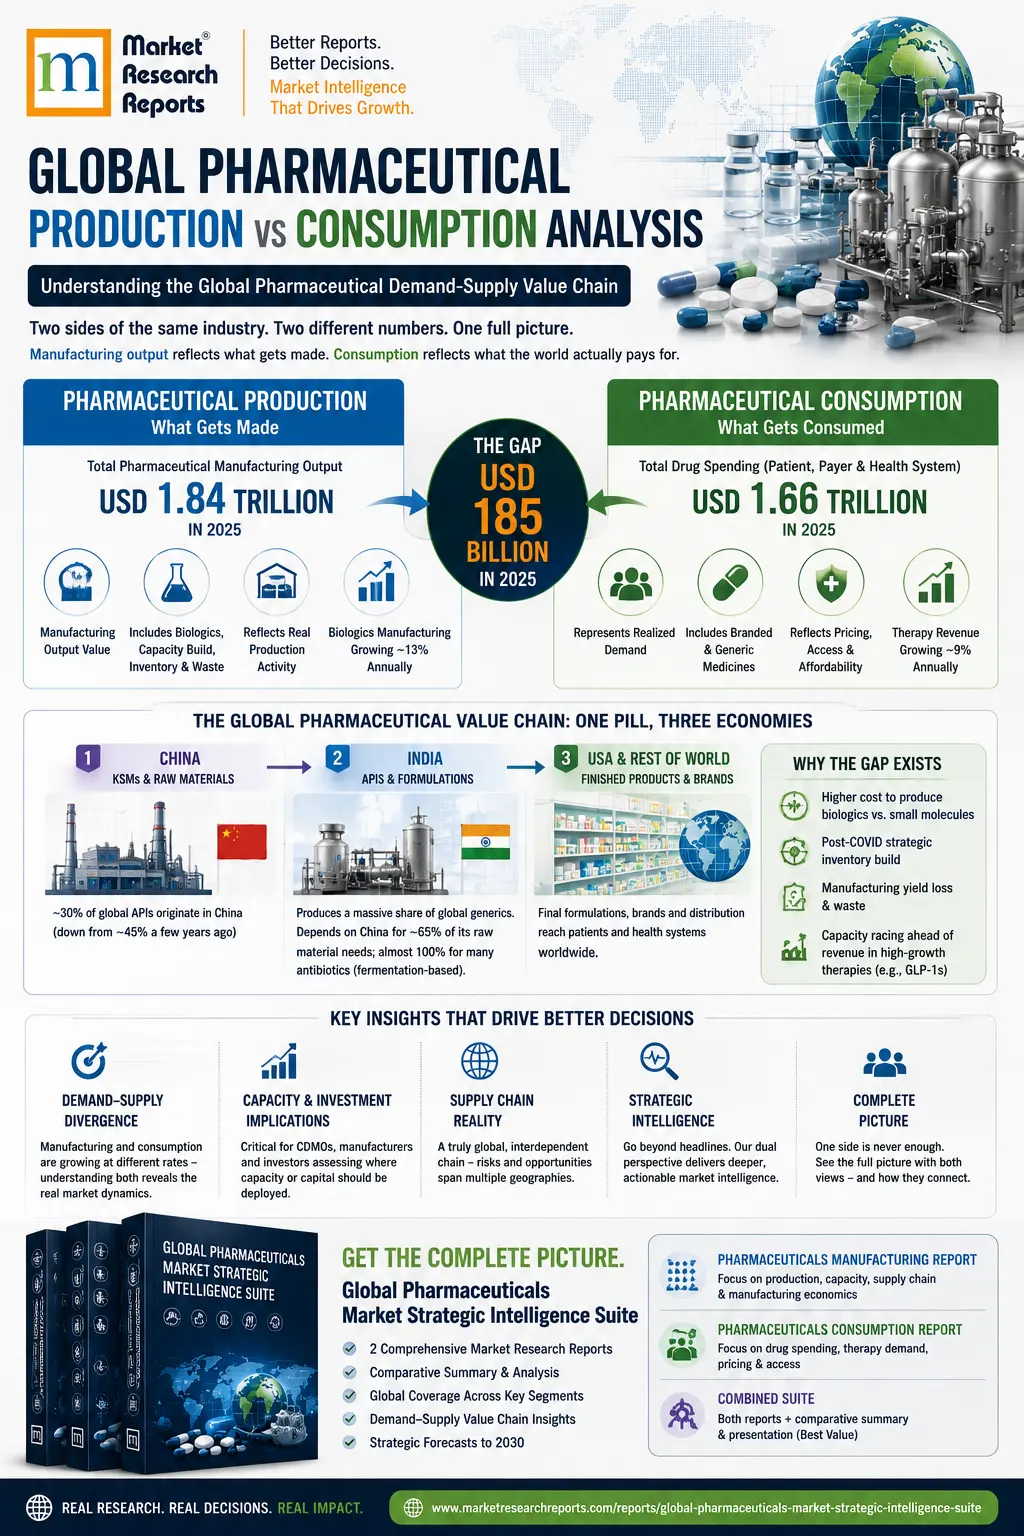
Global pharmaceutical manufacturing production reached an estimated $1.84 trillion in 2025, according to Navadhi Market Research's Global Pharmaceuticals Manufacturing Market Strategic Research Report 2026-2031, projected to reach $2.86 trillion by 2031, a 7.7% CAGR. Global pharmaceutical consumption - end-market drug spending - reached an estimated $1.66 trillion in 2025, according to the companion Global Pharmaceuticals Industry Strategic Research Report 2026-2031, projected to reach $2.45 trillion by 2031, a 6.8% CAGR. These are not the same number measured twice. They are two structurally different measurements of the same industry, and the roughly $180-400 billion gap between them, at any point in the forecast window, is not a rounding error - it is where a real, quantifiable story about global trade, capital allocation, and geopolitical risk actually lives.
Why Two Reports, Not One: A Methodological Case
Most market research on pharmaceuticals answers one of two distinct questions, often without making clear which one it's answering. "How big is the pharmaceutical market" can mean the total value of drugs manufactured, or the total value of drugs purchased by patients, insurers, and health systems. These sound like the same question. They are not, for three specific, structural reasons.
Biologics manufacturing carries a materially different capital intensity than the revenue it eventually generates reflects. Biologics production requires cell culture facilities, cold-chain infrastructure, and specialized fill-finish capacity that costs meaningfully more per unit of output than small-molecule chemical synthesis. This is real, disclosed data: biologics manufacturing value is growing at a 12.8% CAGR in this analysis, compared to 9.0% CAGR for biologics-driven therapy revenue on the consumption side. A market report measuring only end-market drug revenue will systematically undercount the capital reallocation actually happening inside the industry.
Strategic inventory building is invisible in consumption data by definition. Following COVID-19-era supply disruptions, governments and health systems in multiple regions shifted toward holding larger strategic pharmaceutical reserves - production that exists specifically to sit in a warehouse, not to be immediately consumed. This is a real, deliberate policy response with real dollar value, and it only appears in production-side measurement.
The GLP-1 category is the clearest, most current illustration of why this split matters. GLP-1 and peptide-driven manufacturing (the fill-finish and synthesis capacity behind drugs like semaglutide and tirzepatide) is expanding at approximately 24.9% CAGR in this analysis. GLP-1/peptide drug market revenue - what patients and payers actually spend - is growing at approximately 10.2% CAGR over the same period. That is not a contradiction. It reflects an industry racing to build enough manufacturing capacity to meet a demand curve that has outpaced supply since the category's earliest commercial years. A single blended report measuring "the GLP-1 market" as one number would average away the single most important dynamic currently reshaping pharmaceutical capital investment.
Pharmaceutical Manufacturing vs. Pharmaceutical Consumption: A Side-by-Side Comparison
| Dimension | Pharmaceutical Manufacturing | Pharmaceutical Consumption |
|---|---|---|
| What it measures | The value of drugs and drug substances actually produced -- API synthesis, formulation, fill-finish, packaging | The value of drugs actually purchased -- end-market revenue paid by patients, insurers, and health systems |
| 2025 market size | $1.84 trillion | $1.66 trillion |
| 2031 forecast | $2.86 trillion | $2.45 trillion |
| 2025-2031 CAGR | 7.7% | 6.8% |
| Primary geography | Concentrated in China (API/KSMs), India (formulation), Europe (biologics, Switzerland/Ireland), USA | Concentrated in North America (46.8% of global spend), then Europe and Asia-Pacific |
| Who it matters to most | Supply chain executives, manufacturing investors, CDMOs, industrial policy makers, procurement teams | Commercial strategy, payers, investors, portfolio managers, market access teams |
| What moves the number | Capital expenditure cycles, biologics capacity build-out, CDMO investment, reshoring/geopolitical disruption | Drug pricing, reimbursement policy, prescribing volume, patent expirations, new drug launches |
| GLP-1 category growth | ~24.9% CAGR (peptide synthesis and fill-finish capacity) | ~10.2% CAGR (drug market revenue) |
| Key risk factors | Supply chain concentration (China/India dependency), tariff exposure, capacity bottlenecks | Pricing pressure, biosimilar erosion, reimbursement policy shifts |
| Companion Navadhi report | Global Pharmaceuticals Manufacturing Market Strategic Research Report | Global Pharmaceuticals Industry Strategic Research Report |
The table above uses "Manufacturing" deliberately and consistently, because it is the more precise and more widely searched term for the supply-side half of this industry -- "production" is often used loosely to mean either side of the value chain, while "manufacturing" specifically and unambiguously refers to the physical act of making the drug.
The Real Geography: Where Drugs Are Actually Made vs. Where They Are Consumed
This is the part of the pharmaceutical value chain that rarely makes it into consumer-facing coverage of drug pricing, and it is worth being specific and current about it, because the picture has shifted meaningfully even in the past few years.
The active pharmaceutical ingredient (the actual chemical compound that makes a drug work) overwhelmingly starts in China. China's share of global API output by volume stood at roughly 45% in 2022, and while that share is projected to decline toward approximately 30% by 2026 as India and other countries build capacity, China's grip is tightest specifically at the base of the chemical value chain - key starting materials (KSMs) and intermediates, the raw chemical building blocks that even Indian API manufacturers depend on.
India formulates a large share of what the world actually takes, but remains structurally dependent on Chinese chemistry to do it. India is frequently described as the "Pharmacy of the World," producing roughly 20% of global generic drug supply by volume. But India's own government has been explicit about the dependency underneath that position: India's NITI Aayog (the government's own policy think tank) confirmed in a June 2026 report that India relies on China for approximately 65% of its API and key starting material needs - a dependency that is close to absolute for fermentation-based products like antibiotics. China and India together account for nearly 90% of all API filings with the U.S. FDA.
The United States remains the largest single consumption market by a wide margin, while holding a comparatively modest share of upstream production. This is the structural pattern this analysis's own regional data confirms directly: North America accounts for an estimated 46.8% of global pharmaceutical consumption but only 36.7% of global pharmaceutical production - a real, quantified trade deficit of approximately $90 billion in 2025, projected to widen to approximately $191 billion by 2031. Europe runs the inverse pattern, holding 35.6% of production against only 21.6% of consumption, a net export position of approximately $281 billion in 2025.
The result is a supply chain pattern that industry analysts increasingly describe with a specific phrase: China KSMs → Indian APIs → U.S. finished formulations. A single tablet's economic footprint is genuinely distributed across at least three national economies before it reaches a patient, and the geopolitical fragility of that chain is not theoretical - U.S. Section 301 tariffs on Chinese pharmaceutical inputs, and an April 2026 proclamation imposing 100% tariffs on patented pharmaceutical imports under Section 232, have already begun reshaping procurement strategy across the industry in real time.
Who Is Actually Involved: Innovators, Generic Manufacturers, and the CDMOs Behind Them
The company list looks different depending on which side of this value chain you're measuring. Integrated innovators - Eli Lilly, Novo Nordisk, Pfizer, Roche, Johnson & Johnson, AstraZeneca, Novartis, Sanofi, Merck, GSK, AbbVie, Bristol-Myers Squibb - own the drugs and, increasingly, meaningful in-house manufacturing capacity. But a genuinely large and structurally important share of global production capacity sits with a smaller set of specialized contract development and manufacturing organizations (CDMOs) that most consumers have never heard of: Samsung Biologics, Lonza, WuXi Biologics, and Catalent among them.
This distinction has become sharply, concretely relevant in the past year. Confirmed, real supply disruption affecting Chinese CDMOs - WuXi Biologics specifically - has triggered a quantified reshoring wave: of $24.86 billion in total 2025 global CDMO capacity investment, approximately $18.48 billion, nearly three-quarters, flowed specifically to U.S. and other non-China facilities. Samsung Biologics is building what will be the world's largest single-location biologics manufacturing hub in Incheon, South Korea, directly positioned to capture that reshoring demand.
Why Look at Both Sides, and How the Strategic Intelligence Suite Solves It
The comparison table above makes the practical problem clear: manufacturing and consumption answer genuinely different business questions, and most real decisions in this industry actually require both.
A pharmaceutical company evaluating where to build new capacity needs manufacturing-side data -- capex cycles, CDMO availability, regional production costs -- but it also needs consumption-side data to know whether the demand that capacity is meant to serve is real and where it's growing fastest. A CDMO deciding whether to expand in Ireland versus Singapore needs to understand not just current manufacturing cost structures, but which end markets are actually going to buy what that capacity produces. An investor evaluating a company's GLP-1 exposure needs to see both the manufacturing-side capacity race (24.9% CAGR) and the consumption-side revenue realization (10.2% CAGR) to understand whether that company is over- or under-invested relative to real demand. None of these questions can be fully answered from a single-sided report, no matter how detailed.
This is exactly the gap the Global Pharmaceuticals Market Strategic Intelligence Suite is built to close. Rather than requiring a buyer to purchase both reports separately and reconcile the two datasets themselves, the Suite bundles the Manufacturing report, the Industry (Consumption) report, and a set of cross-report deliverables built specifically to compare the two: an executive presentation walking through the production-consumption gap by region, a summary document explaining how the two markets interconnect across the value chain, and an interactive infographic surfacing the headline comparative figures for board-level and investor-facing use. A reader who needs the full picture -- capacity and demand, supply risk and market opportunity, together -- gets that integrated view in one purchase rather than needing to independently cross-reference two separately-scoped reports.
Analyst Insight
The most useful habit this comparative analysis can build in a reader isn't a specific statistic - it's a reflex. The next time a headline cites "the global pharmaceutical market is worth $X," the immediately useful question is which side of this value chain that number is actually measuring, because the answer changes what the number implies. A production-side number worth $1.84 trillion tells you about capital investment, manufacturing employment, and trade exposure. A consumption-side number worth $1.66 trillion tells you about patient access, payer burden, and pricing policy. Conflating them, even unintentionally, produces analysis that sounds precise while actually averaging together two different economic stories. That is the specific, structural reason this analysis is built and published as two separate, cross-referenced reports rather than one blended estimate - not because splitting them is a novel idea in this industry, but because the connective analysis between the two sides is where the genuinely useful insight tends to live, and that connective layer is what most single-sided market coverage leaves out.
Frequently Asked Questions
Why does pharmaceutical production value exceed consumption value?
Three structural reasons: biologics manufacturing carries higher capital intensity per revenue dollar than the eventual therapy pricing reflects; strategic inventory and safety-stock building (a real, post-COVID policy shift) adds production value with no corresponding immediate consumption; and manufacturing yield losses, expired product, and stability samples count as production value but never reach a patient.
Is China's or India's role in pharmaceutical manufacturing changing?
Yes, measurably. China's share of global API output is projected to decline from roughly 45% (2022) toward approximately 30% by 2026, while India is expanding capacity to close that gap. But India's own government (NITI Aayog) has confirmed India remains dependent on China for roughly 65% of its own API and key starting material needs, meaning the "China to India" narrative is real but structurally incomplete without accounting for this upstream dependency.
What is the real dollar gap between pharmaceutical production and consumption?
Approximately $185 billion in 2025 ($1.84 trillion production vs. $1.66 trillion consumption), on a trajectory to widen further by 2031 given production's faster 7.7% CAGR versus consumption's 6.8% CAGR.
Why is GLP-1 manufacturing growing so much faster than GLP-1 drug sales?
Because manufacturing capacity has been the binding constraint on the category since its earliest commercial years, not demand. GLP-1/peptide manufacturing capacity is expanding at roughly 24.9% CAGR specifically to close a real, ongoing supply gap against drug-market revenue growing at roughly 10.2% CAGR.
Should I use the Manufacturing report or the Industry report for my research?
If your question is about capacity, capital investment, trade exposure, or supply chain risk, start with the Manufacturing report. If your question is about market revenue, competitive positioning, pricing, or patient access, start with the Industry report. For questions that touch both - capacity planning against real demand growth, or evaluating a company across its full value chain exposure - the combined Strategic Intelligence Suite is built specifically for that comparative use case.
For full market sizing, country-level detail, and complete company profiles on both sides of this value chain, see the companion Global Pharmaceuticals Industry Strategic Research Report and Global Pharmaceuticals Manufacturing Market Strategic Research Report, or the combined Global Pharmaceuticals Market Strategic Intelligence Suite. For bespoke pharmaceutical supply chain analysis, commission custom research.