


The Multi-Year Wait: Inside the Interconnection Queue Crisis Strangling the World's Grid Investment Supercycle
MRR® Industry Intelligence Briefing Energy Infrastructure · Grid Technology · Capital Markets
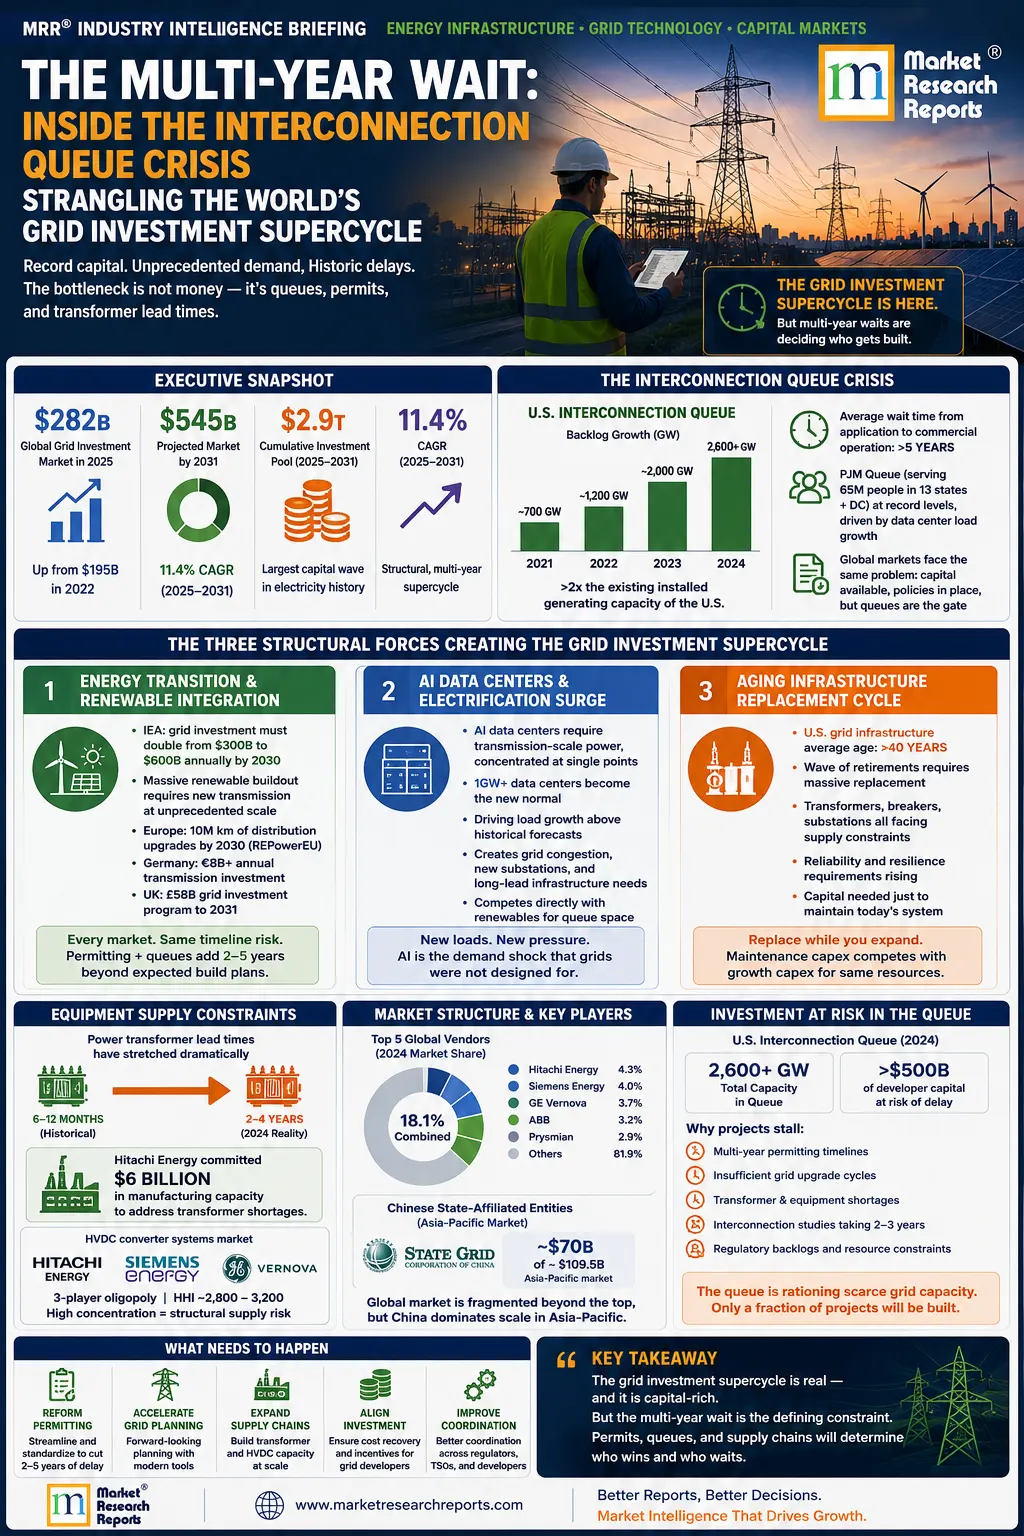
The global grid modernisation and transmission infrastructure market reached USD 282 billion in 2025 and is on course to reach USD 545 billion by 2031 — a near-doubling in seven years representing a cumulative investment pool of USD 2.9 trillion. The constraint is not capital. In almost every major grid market in the world, more money is trying to enter than the physical, regulatory, and supply-chain infrastructure can absorb. Here is what is driving the largest sustained period of grid capital investment in the history of the electricity sector, who is capturing the equipment revenues, and which structural bottlenecks are determining which projects actually get built.
Executive Summary
The global grid modernisation and transmission infrastructure investment market is not experiencing a cyclical upturn. The USD 282 billion market registered in 2025 — up from USD 195 billion in 2022, representing 13.2% compound growth over the two-year base period — reflects the simultaneous convergence of three structurally irreversible secular forces: an energy transition requiring grid investment at a rate the IEA estimates must double from USD 300 billion to USD 600 billion annually by 2030; an AI data centre electrification wave creating transmission-scale load concentrations that existing grids in multiple jurisdictions cannot accommodate; and a mandatory replacement cycle for aging infrastructure averaging more than 40 years of age in the United States. The market is projected to expand at an 11.4% CAGR (2025–2031) to reach USD 545 billion, with a cumulative investment pool exceeding USD 2.9 trillion over the forecast period, according to Navadhi Market Research's Global Grid Modernisation & Transmission Infrastructure Investment Market Strategic Research Report 2026–2031. The equipment and technology supply side of this market is structurally concentrated — the top five vendors (Hitachi Energy, Siemens Energy, GE Vernova, ABB, and Prysmian) collectively capture approximately 18.1% of the USD 250 billion 2024 market — while the broader market remains fragmented by the dominant presence of Chinese state-affiliated entities, principally State Grid Corporation of China, which account for approximately USD 70 billion of the approximately USD 109.5 billion Asia-Pacific market. The single most important conclusion for any buyer, investor, or policy analyst examining this market in 2026 is this: the bottleneck is not demand or capital. It is permitting timelines, transformer supply chain lead times measured in years rather than months, and interconnection queues so large that they effectively ration which projects convert from planning to construction.
The Research Problem: Why a $2.9 Trillion Investment Pool Is Still Undersupplying the Market
Every major electricity market in the world is simultaneously experiencing the same structural problem: the rate of new generation and load interconnection applications far exceeds the grid's physical and regulatory capacity to accommodate them. The PJM Interconnection queue in the United States — which serves 65 million people across 13 states and the District of Columbia — reached record levels in 2024, driven primarily by data centre load growth applications from technology companies whose AI infrastructure buildouts require power at a scale comparable to medium-sized cities concentrated on a single transmission interconnection point. Nationwide in the US, the Lawrence Berkeley National Laboratory's annual interconnection queue study has tracked a backlog growing from approximately 700 GW in 2021 to over 2,600 GW by 2024 — more than twice the existing installed generating capacity of the entire country — with average wait times from application to commercial operation stretching to more than five years.
This is not a US-specific problem. In Europe, the REPowerEU programme requires 10 million kilometres of distribution network upgrades by 2030; Germany's four transmission system operators (TSOs) collectively invest EUR 8 billion-plus annually in backbone transmission; and the UK's National Grid is underpinning a £58 billion grid investment programme to 2031. Every major project faces the same sequence: capital is available, the policy mandate exists, the technology is procurable, but permitting and interconnection queues extend timelines by two to five years beyond what the generation or load developer's business case assumed. The capital overhang is compounding annually.
At the equipment supply layer, the situation is structurally more acute. Power transformer lead times — historically six to twelve months for large units — had extended to two to four years by 2024, driven by a wave of simultaneous retirements of aging grid equipment, new renewable interconnection demand, and AI data centre load growth. Hitachi Energy alone committed USD 6 billion in manufacturing capacity investment specifically to address transformer supply constraints. The HVDC converter systems market — technically the highest-growth sub-segment within the broader market — is effectively a three-player oligopoly between Hitachi Energy, Siemens Energy Grid Technologies, and GE Vernova, with an implicit sub-segment Herfindahl-Hirschman Index approaching 2,800–3,200. When three companies between them supply the dominant share of the technology the global energy transition most depends on, supply constraints compound demand constraints to produce the multi-year wait the market title names.
The Three Structural Forces Creating the Grid Investment Supercycle
Force 1 — Energy Transition and Renewable Integration: The Dominant Long-Term Catalyst
Every gigawatt of renewable generation capacity requires approximately 3–4 times more grid infrastructure investment per GW than equivalent thermal capacity replacement. This multiplier arises from three distinct factors: the geographic remoteness of high-quality renewable resource zones from established load centres, necessitating long-distance transmission corridors; the intermittency of wind and solar, demanding additional grid flexibility and balancing infrastructure; and the non-synchronous nature of inverter-based renewable generation, which introduces grid stability requirements — reactive power compensation, synthetic inertia — that do not arise with conventional rotating generation. Solar installations alone surpassed 400 GW globally in 2024, creating a structural grid investment demand that has no precedent in the modern electricity system. The IEA has explicitly quantified this: annual global grid investment must double from approximately USD 300 billion to USD 600 billion by 2030 to maintain alignment with net-zero energy transition commitments.
Force 2 — AI Data Centre Electrification: The Acute Near-Term Demand Surge
A single hyperscale AI data centre campus of 1–2 GW capacity requires dedicated transmission substation connections, regional network reinforcement, and in many cases new 345kV or 500kV transmission circuit construction. As of 2024, hyperscale technology operators had collectively announced data centre investment programmes totalling multiple hundreds of billions of dollars. This demand concentration — electricity loads comparable to mid-sized cities, materialising on single transmission interconnection points on three to five year development timelines — is the primary driver of the PJM queue crisis and the European TSO capacity concerns. It is also the demand force with the steepest near-term trajectory: AI infrastructure buildout does not slow during economic cycles the way industrial or commercial construction does.
Force 3 — Aging Infrastructure Replacement: The Non-Discretionary Baseline
US DOE data indicates the US electricity grid averages more than 40 years of age, with some transmission components exceeding 50–70 years. This deterioration creates a capital replacement cycle that utilities cannot defer without incurring reliability, safety, and regulatory compliance risks — a fundamentally non-discretionary investment demand that is structurally separate from, and additive to, the growth-driven investment in renewable integration and data centre connections. The combination of both a replacement cycle and a growth-driven new-build cycle operating simultaneously is what drives the 11.4% CAGR forecast rather than the more modest growth rates historically associated with regulated utility capital expenditure.
The Competitive Landscape: Who Is Capturing the Equipment Revenue
| Company | Primary Grid Segment | Est. Grid Revenue 2024 | Est. Market Share | Key Order Visibility |
|---|---|---|---|---|
| Hitachi Energy | Transformers, HVDC, Grid Automation | ~USD 16.0B | ~6.4% | USD 22B+ backlog mid-2024; USD 6B manufacturing capex committed |
| Siemens Energy Grid Technologies | HVDC, GIS, Transformers, Digital Grid | ~USD 8.7B | ~3.5% | Siemens Energy group backlog EUR 123B (FY2024) |
| GE Vernova Electrification | Grid Solutions, HVDC, Software, Protection & Control | ~USD 7.3B | ~2.9% | Backlog tripled vs. 2022 levels |
| ABB (Grid-Relevant Electrification) | Grid Automation, Distribution, SCADA | ~USD 6.8B | ~2.7% | Part of USD 18.8B Electrification segment |
| Prysmian Group (Transmission) | HVDC/HVAC Cables, Offshore Array | ~USD 6.5B | ~2.6% | HVDC backlog ~EUR 4.6B (H1 2024) |
| Top 5 Combined | ~USD 45.3B | ~18.1% | ||
| China State Affiliates (SGCC, XD Group, TBEA, NR Electric) | Domestic Chinese market; selective exports | ~USD 70B | ~28% | Captive domestic procurement; limited Western competitive impact |
| Global Market (2024) | ~USD 250B | 100% | Navadhi Market Research estimate |
Source: Navadhi Market Research, Global Grid Modernisation & Transmission Infrastructure Investment Market Strategic Research Report 2026–2031; individual company annual reports and investor presentations 2024–2025.
The market's HHI at the technology supply level (excluding utility-side capex and grid construction) sits at approximately 650–750 — moderately fragmented overall. At the sub-segment level, however, concentration is materially higher: the HVDC converter market is a functional three-player oligopoly, and the HVDC submarine cable market is concentrated between Prysmian and Nexans with periodic participation by Sumitomo Electric.
The Regional Picture: Where the Growth Is Fastest
| Region | 2025 Estimate | 2031 Forecast | CAGR 2025–2031 | Primary Driver |
|---|---|---|---|---|
| Asia-Pacific | USD 123.1B | USD 237.2B | 11.3% | China SGCC (CNY 500B+ annually), India Green Energy Corridors |
| North America | USD 65.4B | USD 127.8B | 11.5% | IIJA USD 65B, FERC Order 1920, AI data centre load growth |
| Europe | USD 60.8B | USD 117.5B | 11.4% | REPowerEU, North Sea offshore wind, Germany SuedLink/SuedOstLink |
| Middle East & Africa | Growing fastest | Growing fastest | 13.2% | Saudi Vision 2030, 70% renewable target, SEC SAR 500B+ capex |
| Latin America | Steady growth | Steady growth | ~9.5% | Brazil-anchored; cross-border interconnection |
Source: Navadhi Market Research, Global Grid Modernisation & Transmission Infrastructure Investment Market Strategic Research Report 2026–2031.
The Middle East & Africa region's 13.2% CAGR — fastest of any region — reflects Saudi Arabia's Vision 2030 programme targeting 70% renewable penetration, underpinned by Saudi Electricity Company capex commitments of SAR 500 billion-plus. This is the least well-recognised growth vector in the global market and the one most likely to produce positive surprises for grid equipment vendors with established local partnerships.
The Bottleneck Layer: Three Structural Inhibitors That Cap Realised Growth
The market's growth trajectory, while structural in origin, is constrained by a set of inhibitors that determine the gap between planned investment and executed capital deployment.
Permitting and environmental approval timelines are the single most consequential constraint in the United States and many European jurisdictions. A new 500kV transmission line from planning to energisation can require seven to fifteen years to complete in the US, versus two to five years in comparable jurisdictions in Asia. FERC Order 1920, adopted in May 2024 and mandating proactive transmission planning rather than reactive expansion, is the most significant US regulatory response to this problem, projected by analysts to catalyse USD 100 billion-plus in new transmission investment through regulated utility frameworks — but the order itself does not accelerate the permitting process. It mandates planning; the physical execution timeline remains constrained by environmental review processes outside FERC's jurisdiction.
Critical equipment supply chain constraints — principally power transformers — are the second binding constraint. The transformer supply crisis is the direct consequence of a demand step-change that the existing global manufacturing base, sized for pre-energy-transition order volumes, cannot absorb on a near-term basis. Hitachi Energy's USD 6 billion manufacturing investment is targeted at this gap, but new factory capacity takes two to four years to commission. The structural implication is that even projects that have cleared permitting face equipment delivery queues extending their in-service dates by twelve to thirty-six months beyond original projections.
Skilled workforce shortage is the constraint that policy documents discuss least and project schedules encounter most. Transmission line construction, substation engineering, and HVDC commissioning require a specialist labour force that is both globally scarce and geographically concentrated. The rapid simultaneous scaling of grid investment programmes across North America, Europe, and the Middle East is competing for the same pool of qualified engineers, creating wage inflation and schedule extensions that do not appear in any policy commitment document but consistently appear in actual project delivery timelines.
Analyst Insight
The policy frameworks supporting this market are the most concentrated and geographically broad in the history of the electricity sector: the US Infrastructure Investment and Jobs Act, FERC Order 1920, the Inflation Reduction Act, REPowerEU, Germany's SuedLink and SuedOstLink, the UK's National Grid programme, China's 14th Five-Year Plan, and Saudi Arabia's Vision 2030 are simultaneously active, covering every major economy. This multi-jurisdictional policy architecture is the market's primary structural strength - no single regulatory reversal or government transition can materially disrupt global market trajectory when the investment mandate is replicated across all five regions simultaneously. The risk to the 11.4% CAGR forecast is not demand destruction. It is execution capacity: permitting queues, transformer lead times, and skilled labour shortages are the three constraints that determine whether USD 2.9 trillion in committed investment reaches the grid or sits in development queues for an additional five-year cycle.
Strategic Lessons for Market Participants
| Observation | Strategic Implication |
|---|---|
| The HVDC sub-market is a functional three-player oligopoly | New entrants seeking grid equipment exposure should target established Tier 2 segments (cables, protection, automation) rather than HVDC converter systems, where qualification barriers and long-cycle customer relationships effectively close the market to new competition |
| Middle East & Africa carries the highest regional CAGR at 13.2% | Vendors without existing Saudi Arabia and UAE utility relationships are structurally disadvantaged in the fastest-growing regional pocket; local partnership formation decisions made in 2025–2026 determine 2028–2031 revenue participation |
| Equipment backlog duration is a more reliable demand indicator than policy announcement volume | Hitachi Energy's USD 22B+ mid-2024 backlog, Siemens Energy's EUR 123B group backlog, and GE Vernova's tripled backlog vs. 2022 are auditable leading indicators of multi-year revenue visibility that policy announcements — which frequently shift between commitment and execution — do not provide |
| The interconnection queue is a secondary project pipeline, not a demand destruction signal | Over 2,600 GW of applications in the US queue does not mean 2,600 GW will be built — but it does mean that the demand origination pipeline for grid equipment orders is effectively insured against any near-term demand shortfall |
Frequently Asked Questions
Why is this market growing at 11.4% CAGR if there are so many execution bottlenecks?
The CAGR reflects actual capital deployment, not application volume. Despite permitting constraints, transformer lead times, and workforce shortages, the absolute volume of capital reaching grid infrastructure annually has grown from USD 195 billion (2022) to USD 250 billion (2024) to an estimated USD 282 billion (2025), driven by projects that cleared permitting cycles two to five years earlier now entering active construction. The bottlenecks constrain the ceiling, not the floor of annual deployment.
Which segment within the broader market is growing fastest?
HVDC Systems & FACTS (Flexible AC Transmission Systems) is the highest-growth technology segment within the market, reflecting the structural advantage of high-voltage direct current transmission for long-distance renewable energy corridors, offshore wind connections, and cross-border electricity interconnection — all of which are high-priority investment categories across every major grid programme globally.
Does the AI data centre demand compete with renewable energy for grid capacity?
In the near term, yes — both place large demands on the same transmission infrastructure in many geographies, and both contribute to interconnection queue congestion. Over the medium term, the AI data centre demand actually reinforces the renewable integration investment case, since data centre operators are increasingly signing long-term power purchase agreements with renewable developers, creating co-located demand that requires the same grid upgrades.
Why is China's share so large and yet competitively insulated from the Western market?
State Grid Corporation of China and its affiliated suppliers operate within a captive domestic procurement ecosystem managed by a state-owned entity. This generates approximately USD 70 billion in annual grid equipment revenue in Asia-Pacific but competes only selectively in export markets, limiting its disruptive competitive impact on Western-oriented technology supply chains. Chinese grid equipment is competitive on price in export markets where Western vendors do not have entrenched positions, but Western utilities and TSOs have generally maintained procurement policies that favour certified, relationship-qualified vendors with established local service infrastructure.
What happens to this market if interest rates remain elevated?
Grid infrastructure investment is highly sensitive to financing costs because the assets have payback periods measured in decades and are predominantly financed through regulated utility rate bases or long-dated sovereign and project finance instruments. Elevated rates increase the all-in cost of capital for transmission investment and compress the returns available within regulated utility frameworks. However, the structural demand drivers — aging infrastructure replacement and energy transition mandates — are sufficiently non-discretionary that rate sensitivity affects timing and financing structure more than aggregate investment volume over a multi-year horizon.
For full market sizing, regional forecasts, and vendor profiles across the global grid modernisation and transmission infrastructure landscape, see our Global Grid Modernisation & Transmission Infrastructure Investment Market Strategic Research Report 2026–2031. For the AI demand driving the data centre electrification wave discussed in this briefing, read our companion article on the AI industry's pricing and capital challenge. For a bespoke grid market assessment, commission custom research.