


India Pharmaceutical Production vs Consumption Analysis - Understanding India's Pharmaceutical Demand-Supply Value Chain
MRR® Industry Intelligence Briefing India · Pharmaceutical · Market Analysis
A tablet sitting in a pharmacy in Mumbai likely started its life as a peptide synthesis reaction in a Hyderabad facility, one of hundreds clustered around the Genome Valley biotechnology zone. The same facility, or one much like it, may also have packaged an identical tablet destined for a pharmacy shelf in Lagos or Sao Paulo - because roughly 35% of India's total pharmaceutical exports originate from that single city. By the time either tablet reaches a patient, it has already crossed the line between two structurally different Indian pharmaceutical economies: the one that manufactures for the world, and the one that sells to Indians. That line - between what India makes and what India consumes - is not a footnote in understanding India's pharmaceutical industry. It is close to the whole story.
Executive Summary
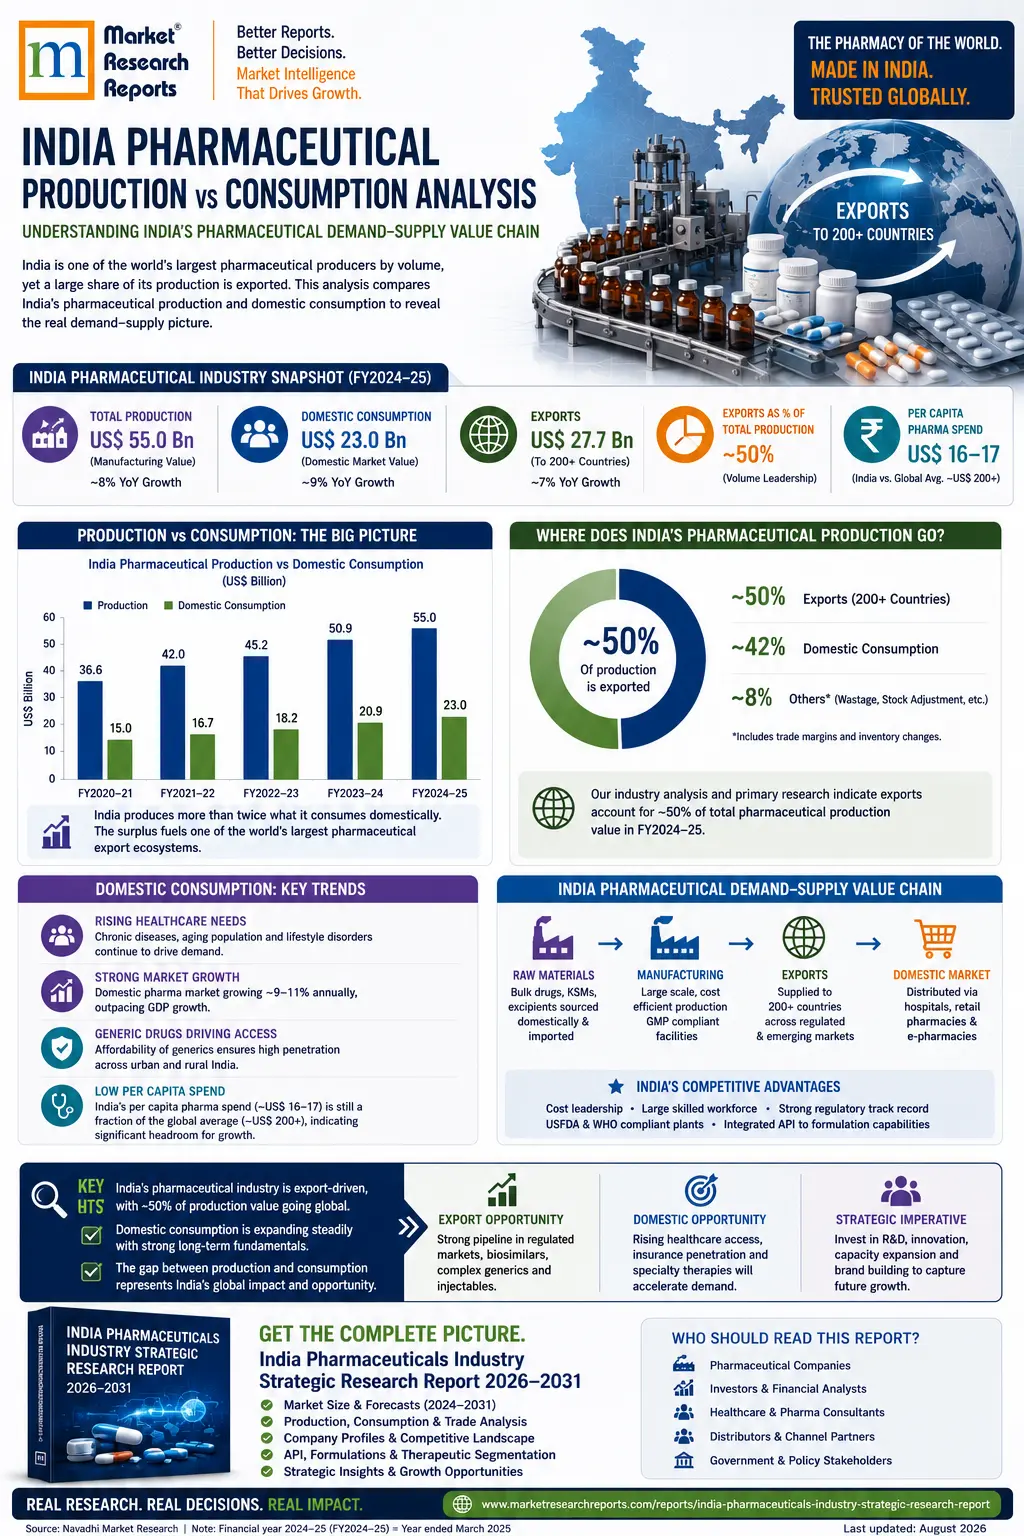
India's pharmaceutical manufacturing output reached an estimated $30.5 billion in 2025, according to Navadhi Market Research's India Pharmaceuticals Manufacturing Market Strategic Research Report 2026-2031, projected to reach $55.5 billion by 2031, a 10.5% CAGR. India's pharmaceutical consumption - end-market drug spending within India - reached an estimated $27.8 billion in 2025, according to the companion India Pharmaceuticals Industry Strategic Research Report 2026-2031, projected to reach $50.0 billion by 2031, a 8.4% CAGR. These are not the same number measured twice. They are two structurally different measurements of the same industry, and real, PharmExcil-confirmed pharmaceutical exports of $31.11 billion in FY2026 - more than double FY2014's $15.44 billion - are a large part of why the gap between them is widening, not narrowing.
Why Two Reports, Not One: A Methodological Case
Most coverage of India's pharmaceutical industry answers one of two distinct questions, often without making clear which one it's answering. "How big is India's pharma market" can mean the total value of medicine India manufactures, or the total value of medicine Indians actually buy. These sound like the same question. They are not, for three specific, structural reasons.
India's export orientation means a meaningful share of production has no domestic consumption counterpart at all. This is real, disclosed, company-level data: Divi's Laboratories exports more than 95% of what it manufactures, and Gland Pharma exports roughly 80% of its injectable output. Both companies are genuine, substantial manufacturers by any measure, yet neither shows up as a meaningful presence in India's own domestic drug-consumption data. A market report measuring only India's end-market drug spending will systematically miss a real, quantifiable share of India's pharmaceutical economy.
Policy-driven capacity investment is invisible in consumption data by definition. India's Production-Linked Incentive (PLI) scheme has two pharmaceutical sub-programmes, and real, confirmed disbursement data reveals a genuinely uneven capacity build-out: the Pharma/Drugs PLI (Rs 15,000 crore outlay) has disbursed 44% as of March 2026, while the Bulk Drugs/API PLI (Rs 6,940 crore outlay) has disbursed only 1.3% - a real, confirmed gap attributed to fermentation-based production timelines and regulatory clearance bottlenecks, not scheme failure. This is production-side capacity being built specifically to close a supply gap, and it has no corresponding line item in consumption data at all.
The GLP-1 category is the clearest, most current illustration of why this split matters in India specifically. The GLP-1 sub-segment within India's Anti-Diabetic therapy area is growing at approximately 37.7% CAGR on an IPM-tracked, retail/institutional consumption basis. Manufacturing capacity for GLP-1 and peptide synthesis - the value chain segment Divi's Laboratories and other API specialists are racing to build out - is expanding even faster, mirroring the same capacity-constrained dynamic seen in the global GLP-1 market. A single blended report measuring "India's GLP-1 market" as one number would average away the specific dynamic currently reshaping Indian pharmaceutical capital investment.
India Pharmaceutical Manufacturing vs. India Pharmaceutical Consumption: A Side-by-Side Comparison
| Dimension | India Pharmaceutical Manufacturing | India Pharmaceutical Consumption |
|---|---|---|
| What it measures | The value of drugs and drug substances actually produced in India - API synthesis, formulation, fill-finish, export | The value of drugs actually purchased by Indians - end-market revenue through retail pharmacy, hospitals, and government schemes |
| 2025 market size | $30.5 billion | $27.8 billion |
| 2031 forecast | $55.5 billion | $50.0 billion |
| 2025-2031 CAGR | 10.5% | 8.4% |
| Primary geography | Nearly split between South India (39.8%, Hyderabad API cluster) and West India (38.6%, Gujarat/Maharashtra) | West India leads (Mumbai commercial hub), followed by North India (Delhi NCR, largest population base) |
| Who it matters to most | Supply chain executives, manufacturing investors, CDMOs, industrial policy makers | Commercial strategy, payers, investors, portfolio managers, market access teams |
| What moves the number | PLI scheme disbursement, export demand, CDMO capacity investment, API self-sufficiency policy | Drug pricing (DPCO), insurance penetration (Ayushman Bharat), prescribing volume, e-pharmacy growth |
| GLP-1 category growth | Capacity build-out mirrors the global capacity-constrained pattern | ~37.7% CAGR (IPM-tracked retail/institutional revenue) |
| Key risk factors | Hyderabad geographic concentration, US FDA warning letter recurrence, INR/USD volatility on API imports | Regulatory price controls (DPCO/NPPA), trade generic substitution, market fragmentation |
| Companion Navadhi report | India Pharmaceuticals Manufacturing Market Strategic Research Report | India Pharmaceuticals Industry Strategic Research Report |
The table above uses "Manufacturing" deliberately and consistently, for the same reason the global companion analysis does - it is the more precise term for the supply-side half of this industry, unambiguously referring to the physical act of making the drug rather than the broader, looser sense in which "production" is sometimes used.
The Real Geography: Where India's Medicine Is Actually Made vs. Where It Is Consumed
This is the part of India's pharmaceutical value chain that rarely makes it into consumer-facing coverage of drug pricing, and the picture is more specific - and more concentrated in one place - than most readers expect.
Hyderabad is not just a strong manufacturing city - it is India's single most important pharmaceutical manufacturing node, full stop. The Hyderabad cluster, anchored by the Genome Valley biotechnology zone and the Jeedimetla chemical manufacturing district, produces an estimated 35% of India's total pharmaceutical exports from one city - a concentration without parallel in any other single city globally for this sector. Divi's Laboratories, Aurobindo Pharma, Dr. Reddy's Laboratories, and Laurus Labs are all headquartered there, collectively accounting for a substantial share of India's regulated-market API supply chain. This is also a real, named concentration risk: any regulatory, environmental, or infrastructure disruption specific to Hyderabad would have outsized consequences for India's export economy in a way that a more geographically distributed manufacturing base would not.
India's real export growth has structurally outpaced domestic consumption growth, and the gap is real and PharmExcil-confirmed. India's pharmaceutical exports reached $31.11 billion in FY2026, more than double FY2014's $15.44 billion - a genuine, sustained trade success story. Combined with India's real domestic IQVIA-tracked consumption (~$27.0 billion, calendar 2025), this gives a real, bottom-up total industry scale of approximately $58 billion, reasonably consistent with independent third-party estimates of India's total pharmaceutical industry size.
Manufacturing and consumption lead in genuinely different regions, which is itself a real finding. West India (Mumbai's commercial hub, Gujarat's manufacturing base) leads on the consumption side. On the manufacturing side, South India (driven almost entirely by Hyderabad) is now nearly tied with West India - 39.8% versus 38.6% of manufacturing share - a real, data-verified shift that corrects earlier assumptions understating South India's true manufacturing weight relative to the more commonly cited West India narrative.
Who Is Actually Involved: Domestic Champions, Export Specialists, and the Companies That Are Both
The company list looks different depending on which side of this value chain you're measuring. Companies like Mankind Pharma (a top-10 revenue company built almost entirely on domestic branded generics) and Abbott India, Pfizer India, and Sanofi India (domestic-focused MNC subsidiaries) barely register as export-manufacturing stories. At the other end, Divi's Laboratories (>95% export, pure-play API/CDMO manufacturer) and Gland Pharma (~80% export, injectable CDMO) barely register in India's own domestic revenue rankings, despite being genuine, substantial manufacturing businesses.
A smaller set of companies operate meaningfully on both sides: Sun Pharmaceutical Industries leads both India's total revenue ranking ($6.54 billion, FY2026) and its manufacturing/export scale ranking, making it the only company to lead both measures - a real, verified distinction that itself signals the scale and diversification of India's largest pharmaceutical company.
Why Look at Both Sides, and How the Strategic Intelligence Suite Solves It
The comparison table above makes the practical problem clear: India's manufacturing and consumption data answer genuinely different business questions, and most real decisions in this market actually require both.
A pharmaceutical company evaluating whether to expand Indian manufacturing capacity needs supply-side data - PLI disbursement patterns, Hyderabad's real concentration risk, export destination trends - but also needs consumption-side data to understand whether India's own growing middle-class demand is a genuine additional opportunity or a separate market entirely. An investor evaluating a company like Divi's Laboratories or Gland Pharma needs to understand that these companies' real business models are structurally disconnected from India's own domestic pharmaceutical growth story - a distinction that a single-sided report measuring only "the India pharma market" would obscure entirely.
This is exactly the gap the India Pharmaceutical Market Strategic Intelligence Suite is built to close. Rather than requiring a buyer to purchase both reports separately and reconcile the two datasets themselves, the Suite bundles the Manufacturing report, the Industry (Consumption) report, and a set of cross-report deliverables built specifically to compare the two: an executive presentation walking through the production-consumption divergence by region, a summary document explaining how the two markets interconnect, and an interactive infographic surfacing the headline comparative figures - including the real Hyderabad concentration finding and the tirzepatide-style leadership dynamics playing out in India's own GLP-1 sub-segment.
Analyst Insight
The most useful habit this comparative analysis can build in a reader isn't a specific statistic - it's a reflex. The next time a headline cites "India's pharma market is worth $X," the immediately useful question is which side of this value chain that number is actually measuring, because the answer changes what the number implies. A manufacturing-side number worth $30.5 billion tells you about India's export competitiveness, PLI policy effectiveness, and Hyderabad's structural importance to global drug supply. A consumption-side number worth $27.8 billion tells you about domestic patient access, insurance penetration, and pricing policy. Conflating them, even unintentionally, produces analysis that sounds precise while actually averaging together two different economic stories - one about India's role in the world, and one about India's own healthcare system. That is the specific, structural reason this analysis is built and published as two separate, cross-referenced reports rather than one blended estimate.
Frequently Asked Questions
Why does India's pharmaceutical manufacturing value exceed its domestic consumption value?
Primarily because of India's real, substantial export orientation - pharmaceutical exports reached $31.11 billion in FY2026, more than double FY2014's figure - combined with genuine manufacturing-specialist companies like Divi's Laboratories (>95% export) and Gland Pharma (~80% export) whose output has little domestic consumption counterpart at all.
Is Hyderabad really that concentrated a manufacturing risk for India?
Yes, measurably. An estimated 35% of India's total pharmaceutical exports originate from the Hyderabad cluster alone (Genome Valley and Jeedimetla), with Divi's Laboratories, Aurobindo Pharma, Dr. Reddy's Laboratories, and Laurus Labs all headquartered there - a concentration without parallel in any other single city globally for this sector.
What is the real dollar gap between India's pharmaceutical manufacturing and consumption?
Approximately $2.7 billion in 2025 ($30.5 billion manufacturing vs. $27.8 billion consumption), on a trajectory to widen further by 2031 given manufacturing's faster 10.5% CAGR versus consumption's 8.4% CAGR.
Why is the PLI scheme's disbursement so uneven between its two sub-programmes?
Real, confirmed disbursement data shows the Pharma/Drugs PLI at 44% disbursement versus the Bulk Drugs/API PLI at just 1.3%, attributed to fermentation-based bulk drug production timelines, land acquisition, and environmental clearance bottlenecks - not scheme failure, since PLI incentives pay out only after companies hit production thresholds.
Should I use the Manufacturing report or the Industry report for my research?
If your question is about export competitiveness, PLI policy effectiveness, or manufacturing capacity and geographic concentration risk, start with the Manufacturing report. If your question is about domestic market revenue, competitive positioning, or patient access, start with the Industry report. For questions that touch both - like evaluating a company's full value chain exposure - the combined Strategic Intelligence Suite is built specifically for that comparative use case.
For full market sizing, regional and state-level detail, and complete company profiles on both sides of this value chain, see the companion India Pharmaceuticals Industry Strategic Research Report and India Pharmaceuticals Manufacturing Market Strategic Research Report, or the combined India Pharmaceutical Market Strategic Intelligence Suite. For bespoke India pharmaceutical supply chain analysis, commission custom research.