Global Defense Industry Strategic Research Report
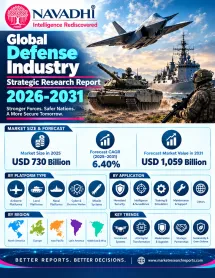
By Type: Combat, Transport and Mission Aircraft, Military Rotorcraft and Tiltrotor Systems, Missiles, Munitions and Air and Missile Defense Systems, Naval Ships, Submarines and Maritime Systems, Armored Vehicles, Artillery and Land Combat Systems, Ammunition, Small Arms and Ordnance, Military Space and Satellite Systems, Unmanned Systems and Counter-Drone Solutions, C4ISR, Radar and Electronic Warfare Systems, Cyber, Defense IT and Mission Software, Military Propulsion, Engines and Subsystems, Nuclear, Strategic and Deterrence Systems, Training, Simulation and Synthetic Environments, Sustainment, Maintenance and Logistics Services
By Application: Air Power and Air Defense, Land Power and Ground Combat, Naval and Maritime Operations, Space and Strategic Deterrence, Intelligence, Surveillance and Reconnaissance, Command, Control, Communications and Cyber Operations, Training, Simulation and Readiness, Logistics, Sustainment and Support Services, Homeland Security, Border Protection and Special Operations
Regional Forecast: Asia Pacific, Latin America, MEA, Europe, North America
Key Players: Lockheed Martin, RTX, Northrop Grumman, BAE Systems, General Dynamics, Boeing, L3Harris Technologies, Leonardo, Airbus (Defence and Space), Thales, Huntington Ingalls Industries, Rheinmetall, Hanwha Aerospace, Leidos, Booz Allen Hamilton, Rolls-Royce (Defence), CACI International, Elbit Systems, Saab, Israel Aerospace Industries, Mitsubishi Heavy Industries, Rafael Advanced Defense Systems, ASELSAN, EDGE Group, Dassault Aviation, SAIC, Hindustan Aeronautics, Textron, Fincantieri, Kawasaki Heavy Industries, ST Engineering, Bharat Electronics, LIG Nex1, Hensoldt, Oshkosh, BWX Technologies, Korea Aerospace Industries, QinetiQ, Curtiss-Wright, Kongsberg Gruppen, CAE, Babcock International, Kratos Defense & Security Solutions, AeroVironment, Embraer
Overview
The global defense industry generated approximately USD 730 billion of revenue in 2025 and is projected to reach about USD 1,059 billion by 2031, a compound annual growth rate of 6.4%. The estimate is deliberately conservative, since it is anchored to the largest ranked producers and does not add unreported activity.
Demand is driven by record order books, higher European budgets, replenishment of munitions and air defense stocks, and rapid adoption of unmanned systems, space assets and electronic warfare. World military expenditure reached USD 2,887 billion in 2025, and prime contractors report multi-year backlogs that make near-term revenue largely contracted.
North America holds roughly half of industry revenue, followed by Europe and Asia Pacific. Europe is the fastest-growing major region as procurement budgets rise, while the Middle East expands through domestic champions and export programs. Missiles and munitions, unmanned systems, space and ammunition grow faster than the market; sustainment grows slower.
The report covers 45 companies across 27 named countries in five regions, with a full 2022 to 2031 value series for every platform type, mission application, region and country.
Scope of the Global Defense Industry Strategic Research Report
This report provides market sizing across platform and mission segments, regional and country splits, a competitive landscape of 45 profiled companies, and forecast analysis for 2025-2031.
Segment by Type
- Combat, Transport and Mission Aircraft
- Military Rotorcraft and Tiltrotor Systems
- Missiles, Munitions and Air and Missile Defense Systems
- Naval Ships, Submarines and Maritime Systems
- Armored Vehicles, Artillery and Land Combat Systems
- Ammunition, Small Arms and Ordnance
- Military Space and Satellite Systems
- Unmanned Systems and Counter-Drone Solutions
- C4ISR, Radar and Electronic Warfare Systems
- Cyber, Defense IT and Mission Software
- Military Propulsion, Engines and Subsystems
- Nuclear, Strategic and Deterrence Systems
- Training, Simulation and Synthetic Environments
- Sustainment, Maintenance and Logistics Services
Segment by Application
- Air Power and Air Defense
- Land Power and Ground Combat
- Naval and Maritime Operations
- Space and Strategic Deterrence
- Intelligence, Surveillance and Reconnaissance
- Command, Control, Communications and Cyber Operations
- Training, Simulation and Readiness
- Logistics, Sustainment and Support Services
- Homeland Security, Border Protection and Special Operations
Who Can Use This Report?
Defense primes and tier-one suppliers planning portfolios; investors and lenders assessing backlog and capacity; government procurement and industrial policy teams; export-control and offset advisers; and new entrants in drones, space and electronic warfare.
Market snapshot
Global Defense Industry Strategic Research Report snapshot, 2025–2031
 © MarketResearchReports.comDisclaimer: The actual data may vary in the final report which undergoes verification check post order confirmation.
Segments covered in this report
Table of contents
01Executive Summary
- 1.1 Market Synopsis
- 1.2 Key Findings
- 1.3 Market Size Methodology and Estimate Reconciliation
02Industry Overview & Forecast
- 2.1.1 Market Definition and Scope
- 2.1.2 Market Value Forecast, 2025-2031
- 2.1.2.1 Demand Backdrop
- 2.1.2.2 Regional Forecast
- 2.1.2.3 Segment Forecast by Platform and Product Type
- 2.1.2.4 Segment Forecast by Mission and End Use
- 2.1.2.5 Company Landscape and Concentration Indicators
- 2.1.3 Historical Market Review, 2022-2025
- 2.1.4 Scenario Analysis (Base, Bull, Bear Cases)
- 2.1.5 Data Quality and Interpretation Notes
03Market Segmentation by Type
- 3.1 Market Segmentation by Type
- 3.1.1 Market by Type Overview
- 3.1.2 Combat, Transport and Mission Aircraft
- 3.1.3 Military Rotorcraft and Tiltrotor Systems
- 3.1.4 Missiles, Munitions and Air and Missile Defense Systems
- 3.1.5 Naval Ships, Submarines and Maritime Systems
- 3.1.6 Armored Vehicles, Artillery and Land Combat Systems
- 3.1.7 Ammunition, Small Arms and Ordnance
- 3.1.8 Military Space and Satellite Systems
- 3.1.9 Unmanned Systems and Counter-Drone Solutions
- 3.1.10 C4ISR, Radar and Electronic Warfare Systems
- 3.1.11 Cyber, Defense IT and Mission Software
- 3.1.12 Military Propulsion, Engines and Subsystems
- 3.1.13 Nuclear, Strategic and Deterrence Systems
- 3.1.14 Training, Simulation and Synthetic Environments
- 3.1.15 Sustainment, Maintenance and Logistics Services
04Market Segmentation by Application
- 4.1 Market Segmentation by Application
- 4.1.1 Market by Application Overview
- 4.1.2 Air Power and Air Defense
- 4.1.3 Land Power and Ground Combat
- 4.1.4 Naval and Maritime Operations
- 4.1.5 Space and Strategic Deterrence
- 4.1.6 Intelligence, Surveillance and Reconnaissance
- 4.1.7 Command, Control, Communications and Cyber Operations
- 4.1.8 Training, Simulation and Readiness
- 4.1.9 Logistics, Sustainment and Support Services
- 4.1.10 Homeland Security, Border Protection and Special Operations
- 4.1.11 Application Outlook and Strategic Implications
05Regional Market Forecast
- 5.1 North America
- 5.2 Europe
- 5.3 Asia Pacific
- 5.4 Middle East & Africa
- 5.5 Latin America
06Country-Level Market Forecast
- 6.1 North America
- 6.1.1 United States
- 6.1.2 Canada
- 6.2 Europe
- 6.2.1 United Kingdom
- 6.2.2 France
- 6.2.3 Germany
- 6.2.4 Italy
- 6.2.5 Russia
- 6.2.6 Sweden
- 6.2.7 Czechia
- 6.2.8 Norway
- 6.2.9 Poland
- 6.2.10 Spain
- 6.2.11 Rest of Europe
- 6.3 Asia Pacific
- 6.3.1 China
- 6.3.2 Japan
- 6.3.3 South Korea
- 6.3.4 India
- 6.3.5 Taiwan
- 6.3.6 Singapore
- 6.3.7 Indonesia
- 6.3.8 Australia
- 6.3.9 Rest of Asia Pacific
- 6.4 Middle East & Africa
- 6.4.1 Israel
- 6.4.2 Turkiye
- 6.4.3 United Arab Emirates
- 6.4.4 Saudi Arabia
- 6.4.5 South Africa
- 6.4.6 Rest of Middle East & Africa
- 6.5 Latin America
- 6.5.1 Brazil
- 6.5.2 Mexico
- 6.5.3 Rest of Latin America
07Growth Drivers & Inhibitors
08Key Company Profiles
- 8.1 Lockheed Martin
- 8.1.1 Company Overview
- 8.1.2 Key Products & Segments
- 8.1.3 Financial Performance (2023–2025)
- 8.1.4 Business Strategy
- 8.1.5 SWOT Analysis
- 8.1.6 Strategic Implications (2025–2031)
- 8.2 RTX
- 8.2.1 Company Overview
- 8.2.2 Key Products & Segments
- 8.2.3 Financial Performance (2023–2025)
- 8.2.4 Business Strategy
- 8.2.5 SWOT Analysis
- 8.2.6 Strategic Implications (2025–2031)
- 8.3 Northrop Grumman
- 8.3.1 Company Overview
- 8.3.2 Key Products & Segments
- 8.3.3 Financial Performance (2023–2025)
- 8.3.4 Business Strategy
- 8.3.5 SWOT Analysis
- 8.3.6 Strategic Implications (2025–2031)
- 8.4 BAE Systems
- 8.4.1 Company Overview
- 8.4.2 Key Products & Segments
- 8.4.3 Financial Performance (2023–2025)
- 8.4.4 Business Strategy
- 8.4.5 SWOT Analysis
- 8.4.6 Strategic Implications (2025–2031)
- 8.5 General Dynamics
- 8.5.1 Company Overview
- 8.5.2 Key Products & Segments
- 8.5.3 Financial Performance (2023–2025)
- 8.5.4 Business Strategy
- 8.5.5 SWOT Analysis
- 8.5.6 Strategic Implications (2025–2031)
- 8.6 Boeing
- 8.6.1 Company Overview
- 8.6.2 Key Products & Segments
- 8.6.3 Financial Performance (2023–2025)
- 8.6.4 Business Strategy
- 8.6.5 SWOT Analysis
- 8.6.6 Strategic Implications (2025–2031)
- 8.7 L3Harris Technologies
- 8.7.1 Company Overview
- 8.7.2 Key Products & Segments
- 8.7.3 Financial Performance (2023–2025)
- 8.7.4 Business Strategy
- 8.7.5 SWOT Analysis
- 8.7.6 Strategic Implications (2025–2031)
- 8.8 Leonardo
- 8.8.1 Company Overview
- 8.8.2 Key Products & Segments
- 8.8.3 Financial Performance (2023–2025)
- 8.8.4 Business Strategy
- 8.8.5 SWOT Analysis
- 8.8.6 Strategic Implications (2025–2031)
- 8.9 Airbus (Defence and Space)
- 8.9.1 Company Overview
- 8.9.2 Key Products & Segments
- 8.9.3 Financial Performance (2023–2025)
- 8.9.4 Business Strategy
- 8.9.5 SWOT Analysis
- 8.9.6 Strategic Implications (2025–2031)
- 8.10 Thales
- 8.10.1 Company Overview
- 8.10.2 Key Products & Segments
- 8.10.3 Financial Performance (2023–2025)
- 8.10.4 Business Strategy
- 8.10.5 SWOT Analysis
- 8.10.6 Strategic Implications (2025–2031)
- 8.11 Huntington Ingalls Industries
- 8.11.1 Company Overview
- 8.11.2 Key Products & Segments
- 8.11.3 Financial Performance (2023–2025)
- 8.11.4 Business Strategy
- 8.11.5 SWOT Analysis
- 8.11.6 Strategic Implications (2025–2031)
- 8.12 Rheinmetall
- 8.12.1 Company Overview
- 8.12.2 Key Products & Segments
- 8.12.3 Financial Performance (2023–2025)
- 8.12.4 Business Strategy
- 8.12.5 SWOT Analysis
- 8.12.6 Strategic Implications (2025–2031)
- 8.13 Hanwha Aerospace
- 8.13.1 Company Overview
- 8.13.2 Key Products & Segments
- 8.13.3 Financial Performance (2023–2025)
- 8.13.4 Business Strategy
- 8.13.5 SWOT Analysis
- 8.13.6 Strategic Implications (2025–2031)
- 8.14 Leidos
- 8.14.1 Company Overview
- 8.14.2 Key Products & Segments
- 8.14.3 Financial Performance (2023–2025)
- 8.14.4 Business Strategy
- 8.14.5 SWOT Analysis
- 8.14.6 Strategic Implications (2025–2031)
- 8.15 Booz Allen Hamilton
- 8.15.1 Company Overview
- 8.15.2 Key Products & Segments
- 8.15.3 Financial Performance (2023–2025)
- 8.15.4 Business Strategy
- 8.15.5 SWOT Analysis
- 8.15.6 Strategic Implications (2025–2031)
- 8.16 Rolls-Royce (Defence)
- 8.16.1 Company Overview
- 8.16.2 Key Products & Segments
- 8.16.3 Financial Performance (2023–2025)
- 8.16.4 Business Strategy
- 8.16.5 SWOT Analysis
- 8.16.6 Strategic Implications (2025–2031)
- 8.17 CACI International
- 8.17.1 Company Overview
- 8.17.2 Key Products & Segments
- 8.17.3 Financial Performance (2023–2025)
- 8.17.4 Business Strategy
- 8.17.5 SWOT Analysis
- 8.17.6 Strategic Implications (2025–2031)
- 8.18 Elbit Systems
- 8.18.1 Company Overview
- 8.18.2 Key Products & Segments
- 8.18.3 Financial Performance (2023–2025)
- 8.18.4 Business Strategy
- 8.18.5 SWOT Analysis
- 8.18.6 Strategic Implications (2025–2031)
- 8.19 Saab
- 8.19.1 Company Overview
- 8.19.2 Key Products & Segments
- 8.19.3 Financial Performance (2023–2025)
- 8.19.4 Business Strategy
- 8.19.5 SWOT Analysis
- 8.19.6 Strategic Implications (2025–2031)
- 8.20 Israel Aerospace Industries
- 8.20.1 Company Overview
- 8.20.2 Key Products & Segments
- 8.20.3 Financial Performance (2023–2025)
- 8.20.4 Business Strategy
- 8.20.5 SWOT Analysis
- 8.20.6 Strategic Implications (2025–2031)
- 8.21 Mitsubishi Heavy Industries
- 8.21.1 Company Overview
- 8.21.2 Key Products & Segments
- 8.21.3 Financial Performance (2023–2025)
- 8.21.4 Business Strategy
- 8.21.5 SWOT Analysis
- 8.21.6 Strategic Implications (2025–2031)
- 8.22 Rafael Advanced Defense Systems
- 8.22.1 Company Overview
- 8.22.2 Key Products & Segments
- 8.22.3 Financial Performance (2023–2025)
- 8.22.4 Business Strategy
- 8.22.5 SWOT Analysis
- 8.22.6 Strategic Implications (2025–2031)
- 8.23 ASELSAN
- 8.23.1 Company Overview
- 8.23.2 Key Products & Segments
- 8.23.3 Financial Performance (2023–2025)
- 8.23.4 Business Strategy
- 8.23.5 SWOT Analysis
- 8.23.6 Strategic Implications (2025–2031)
- 8.24 EDGE Group
- 8.24.1 Company Overview
- 8.24.2 Key Products & Segments
- 8.24.3 Financial Performance (2023–2025)
- 8.24.4 Business Strategy
- 8.24.5 SWOT Analysis
- 8.24.6 Strategic Implications (2025–2031)
- 8.25 Dassault Aviation
- 8.25.1 Company Overview
- 8.25.2 Key Products & Segments
- 8.25.3 Financial Performance (2023–2025)
- 8.25.4 Business Strategy
- 8.25.5 SWOT Analysis
- 8.25.6 Strategic Implications (2025–2031)
- 8.26 SAIC
- 8.26.1 Company Overview
- 8.26.2 Key Products & Segments
- 8.26.3 Financial Performance (2023–2025)
- 8.26.4 Business Strategy
- 8.26.5 SWOT Analysis
- 8.26.6 Strategic Implications (2025–2031)
- 8.27 Hindustan Aeronautics
- 8.27.1 Company Overview
- 8.27.2 Key Products & Segments
- 8.27.3 Financial Performance (2023–2025)
- 8.27.4 Business Strategy
- 8.27.5 SWOT Analysis
- 8.27.6 Strategic Implications (2025–2031)
- 8.28 Textron
- 8.28.1 Company Overview
- 8.28.2 Key Products & Segments
- 8.28.3 Financial Performance (2023–2025)
- 8.28.4 Business Strategy
- 8.28.5 SWOT Analysis
- 8.28.6 Strategic Implications (2025–2031)
- 8.29 Fincantieri
- 8.29.1 Company Overview
- 8.29.2 Key Products & Segments
- 8.29.3 Financial Performance (2023–2025)
- 8.29.4 Business Strategy
- 8.29.5 SWOT Analysis
- 8.29.6 Strategic Implications (2025–2031)
- 8.30 Kawasaki Heavy Industries
- 8.30.1 Company Overview
- 8.30.2 Key Products & Segments
- 8.30.3 Financial Performance (2023–2025)
- 8.30.4 Business Strategy
- 8.30.5 SWOT Analysis
- 8.30.6 Strategic Implications (2025–2031)
- 8.31 ST Engineering
- 8.31.1 Company Overview
- 8.31.2 Key Products & Segments
- 8.31.3 Financial Performance (2023–2025)
- 8.31.4 Business Strategy
- 8.31.5 SWOT Analysis
- 8.31.6 Strategic Implications (2025–2031)
- 8.32 Bharat Electronics
- 8.32.1 Company Overview
- 8.32.2 Key Products & Segments
- 8.32.3 Financial Performance (2023–2025)
- 8.32.4 Business Strategy
- 8.32.5 SWOT Analysis
- 8.32.6 Strategic Implications (2025–2031)
- 8.33 LIG Nex1
- 8.33.1 Company Overview
- 8.33.2 Key Products & Segments
- 8.33.3 Financial Performance (2023–2025)
- 8.33.4 Business Strategy
- 8.33.5 SWOT Analysis
- 8.33.6 Strategic Implications (2025–2031)
- 8.34 Hensoldt
- 8.34.1 Company Overview
- 8.34.2 Key Products & Segments
- 8.34.3 Financial Performance (2023–2025)
- 8.34.4 Business Strategy
- 8.34.5 SWOT Analysis
- 8.34.6 Strategic Implications (2025–2031)
- 8.35 Oshkosh
- 8.35.1 Company Overview
- 8.35.2 Key Products & Segments
- 8.35.3 Financial Performance (2023–2025)
- 8.35.4 Business Strategy
- 8.35.5 SWOT Analysis
- 8.35.6 Strategic Implications (2025–2031)
- 8.36 BWX Technologies
- 8.36.1 Company Overview
- 8.36.2 Key Products & Segments
- 8.36.3 Financial Performance (2023–2025)
- 8.36.4 Business Strategy
- 8.36.5 SWOT Analysis
- 8.36.6 Strategic Implications (2025–2031)
- 8.37 Korea Aerospace Industries
- 8.37.1 Company Overview
- 8.37.2 Key Products & Segments
- 8.37.3 Financial Performance (2023–2025)
- 8.37.4 Business Strategy
- 8.37.5 SWOT Analysis
- 8.37.6 Strategic Implications (2025–2031)
- 8.38 QinetiQ
- 8.38.1 Company Overview
- 8.38.2 Key Products & Segments
- 8.38.3 Financial Performance (2023–2025)
- 8.38.4 Business Strategy
- 8.38.5 SWOT Analysis
- 8.38.6 Strategic Implications (2025–2031)
- 8.39 Curtiss-Wright
- 8.39.1 Company Overview
- 8.39.2 Key Products & Segments
- 8.39.3 Financial Performance (2023–2025)
- 8.39.4 Business Strategy
- 8.39.5 SWOT Analysis
- 8.39.6 Strategic Implications (2025–2031)
- 8.40 Kongsberg Gruppen
- 8.40.1 Company Overview
- 8.40.2 Key Products & Segments
- 8.40.3 Financial Performance (2023–2025)
- 8.40.4 Business Strategy
- 8.40.5 SWOT Analysis
- 8.40.6 Strategic Implications (2025–2031)
- 8.41 CAE
- 8.41.1 Company Overview
- 8.41.2 Key Products & Segments
- 8.41.3 Financial Performance (2023–2025)
- 8.41.4 Business Strategy
- 8.41.5 SWOT Analysis
- 8.41.6 Strategic Implications (2025–2031)
- 8.42 Babcock International
- 8.42.1 Company Overview
- 8.42.2 Key Products & Segments
- 8.42.3 Financial Performance (2023–2025)
- 8.42.4 Business Strategy
- 8.42.5 SWOT Analysis
- 8.42.6 Strategic Implications (2025–2031)
- 8.43 Kratos Defense & Security Solutions
- 8.43.1 Company Overview
- 8.43.2 Key Products & Segments
- 8.43.3 Financial Performance (2023–2025)
- 8.43.4 Business Strategy
- 8.43.5 SWOT Analysis
- 8.43.6 Strategic Implications (2025–2031)
- 8.44 AeroVironment
- 8.44.1 Company Overview
- 8.44.2 Key Products & Segments
- 8.44.3 Financial Performance (2023–2025)
- 8.44.4 Business Strategy
- 8.44.5 SWOT Analysis
- 8.44.6 Strategic Implications (2025–2031)
- 8.45 Embraer
- 8.45.1 Company Overview
- 8.45.2 Key Products & Segments
- 8.45.3 Financial Performance (2023–2025)
- 8.45.4 Business Strategy
- 8.45.5 SWOT Analysis
- 8.45.6 Strategic Implications (2025–2031)
09Competitive Landscape
- 9.1 Competitive Landscape Overview
- 9.2 Competitive Intensity Assessment
- 9.2.1 Tier Structure
- 9.2.2 Capacity versus Demand
- 9.2.3 Pricing Environment
- 9.2.4 Barriers to Entry and Exit
- 9.3 Key Player Strategies & Positioning
- 9.3.1 Strategic Group Map
- 9.3.2 Differentiation Strategies
- 9.3.3 Geographic Strongholds
- 9.3.4 M&A and Partnership Activity (2022–Present)
- 9.3.5 R&D and Technology Investment Trends
- 9.4 Competitive Dynamics & Strategic Outlook
- 9.4.1 Emerging Competitive Threats
- 9.4.2 Consolidation versus Fragmentation
- 9.4.3 Competitive Response Matrix
- 9.4.4 Strategic Recommendations, 2025-2031
10Porter's Five Forces Analysis
- 10.1 Threat of New Entrants
- 10.2 Bargaining Power of Buyers
- 10.3 Bargaining Power of Suppliers
- 10.4 Threat of Substitutes
- 10.5 Competitive Rivalry
11PESTLE Analysis
12SWOT Analysis
13Future Trends & Outlook
- 13.1 Munitions and Air Defense Scale-Up
- 13.1.1 Production Capacity as the Binding Constraint
- 13.1.2 Layered and Integrated Air Defense Demand
- 13.1.3 Allied Co-Production and Localization
- 13.2 Autonomy, Drones and Counter-Drone Systems
- 13.2.1 Attritable and Collaborative Platforms
- 13.2.2 Counter-Unmanned Aircraft Systems
- 13.2.3 Artificial Intelligence and Software-Defined Capability
- 13.2.4 Regulatory and Ethical Considerations
- 13.3 Space and Electronic Warfare
- 13.3.1 Military Space
- 13.3.2 Electronic Warfare and Spectrum Operations
- 13.3.3 Convergence Across Domains
- 13.4 Long-Term Market Outlook (2032-2035)
- 13.4.1 Base Case
- 13.4.2 Upside Considerations
- 13.4.3 Downside Considerations
- 13.4.4 Structural Shifts to Monitor
- 13.5 Investment & M&A Activity Outlook
- 13.5.1 Drivers of Transaction Activity
- 13.5.2 Private Capital and Non-Traditional Entrants
- 13.5.3 Regulatory and Execution Considerations
- 13.5.4 Outlook
- 13.6 Summary of Key Outlook Implications
Tables and figures
- 2.1 Exhibit 2.1: Forecast of Global (in USD Bn)
- 2.2 Exhibit 2.2: Forecast of Global Market YoY Growth Rate & CAGR Summary (in %)
- 2.3 Exhibit 2.3: Forecast of North America (in USD Bn)
- 2.4 Exhibit 2.4: Forecast of Europe (in USD Bn)
- 2.5 Exhibit 2.5: Forecast of Asia Pacific (in USD Bn)
- 2.6 Exhibit 2.6: Forecast of Middle East & Africa (in USD Bn)
- 2.7 Exhibit 2.7: Forecast of Latin America (in USD Bn)
- 3.8 Exhibit 3.8: Forecast of Combat, Transport and Mission Aircraft (in USD Bn)
- 3.9 Exhibit 3.9: Forecast of Military Rotorcraft and Tiltrotor Systems (in USD Bn)
- 3.10 Exhibit 3.10: Forecast of Missiles, Munitions and Air and Missile Defense Systems (in USD Bn)
- 3.11 Exhibit 3.11: Forecast of Naval Ships, Submarines and Maritime Systems (in USD Bn)
- 3.12 Exhibit 3.12: Forecast of Armored Vehicles, Artillery and Land Combat Systems (in USD Bn)
- 3.13 Exhibit 3.13: Forecast of Ammunition, Small Arms and Ordnance (in USD Bn)
- 3.14 Exhibit 3.14: Forecast of Military Space and Satellite Systems (in USD Bn)
- 3.15 Exhibit 3.15: Forecast of Unmanned Systems and Counter-Drone Solutions (in USD Bn)
- 3.16 Exhibit 3.16: Forecast of C4ISR, Radar and Electronic Warfare Systems (in USD Bn)
- 3.17 Exhibit 3.17: Forecast of Cyber, Defense IT and Mission Software (in USD Bn)
- 3.18 Exhibit 3.18: Forecast of Military Propulsion, Engines and Subsystems (in USD Bn)
- 3.19 Exhibit 3.19: Forecast of Nuclear, Strategic and Deterrence Systems (in USD Bn)
- 3.20 Exhibit 3.20: Forecast of Training, Simulation and Synthetic Environments (in USD Bn)
- 3.21 Exhibit 3.21: Forecast of Sustainment, Maintenance and Logistics Services (in USD Bn)
- 4.22 Exhibit 4.22: Forecast of Air Power and Air Defense (in USD Bn)
- 4.23 Exhibit 4.23: Forecast of Land Power and Ground Combat (in USD Bn)
- 4.24 Exhibit 4.24: Forecast of Naval and Maritime Operations (in USD Bn)
- 4.25 Exhibit 4.25: Forecast of Space and Strategic Deterrence (in USD Bn)
- 4.26 Exhibit 4.26: Forecast of Intelligence, Surveillance and Reconnaissance (in USD Bn)
- 4.27 Exhibit 4.27: Forecast of Command, Control, Communications and Cyber Operations (in USD Bn)
- 4.28 Exhibit 4.28: Forecast of Training, Simulation and Readiness (in USD Bn)
- 4.29 Exhibit 4.29: Forecast of Logistics, Sustainment and Support Services (in USD Bn)
- 4.30 Exhibit 4.30: Forecast of Segment Application (in USD Bn)
- 6.31 Exhibit 6.31: Forecast of North America (in USD Bn)
- 6.32 Exhibit 6.32: Forecast of United States (in USD Bn)
- 6.33 Exhibit 6.33: Forecast of Canada (in USD Bn)
- 6.34 Exhibit 6.34: Forecast of Europe (in USD Bn)
- 6.35 Exhibit 6.35: Forecast of United Kingdom (in USD Bn)
- 6.36 Exhibit 6.36: Forecast of France (in USD Bn)
- 6.37 Exhibit 6.37: Forecast of Germany (in USD Bn)
- 6.38 Exhibit 6.38: Forecast of Italy (in USD Bn)
- 6.39 Exhibit 6.39: Forecast of Russia (in USD Bn)
- 6.40 Exhibit 6.40: Forecast of Sweden (in USD Bn)
- 6.41 Exhibit 6.41: Forecast of Czechia (in USD Bn)
- 6.42 Exhibit 6.42: Forecast of Norway (in USD Bn)
- 6.43 Exhibit 6.43: Forecast of Poland (in USD Bn)
- 6.44 Exhibit 6.44: Forecast of Spain (in USD Bn)
- 6.45 Exhibit 6.45: Forecast of Rest of Europe (in USD Bn)
- 6.46 Exhibit 6.46: Forecast of Asia Pacific (in USD Bn)
- 6.47 Exhibit 6.47: Forecast of China (in USD Bn)
- 6.48 Exhibit 6.48: Forecast of Japan (in USD Bn)
- 6.49 Exhibit 6.49: Forecast of South Korea (in USD Bn)
- 6.50 Exhibit 6.50: Forecast of India (in USD Bn)
- 6.51 Exhibit 6.51: Forecast of Taiwan (in USD Bn)
- 6.52 Exhibit 6.52: Forecast of Singapore (in USD Bn)
- 6.53 Exhibit 6.53: Forecast of Indonesia (in USD Bn)
- 6.54 Exhibit 6.54: Forecast of Australia (in USD Bn)
- 6.55 Exhibit 6.55: Forecast of Rest of Asia Pacific (in USD Bn)
- 6.56 Exhibit 6.56: Forecast of Middle East & Africa (in USD Bn)
- 6.57 Exhibit 6.57: Forecast of Israel (in USD Bn)
- 6.58 Exhibit 6.58: Forecast of Turkiye (in USD Bn)
- 6.59 Exhibit 6.59: Forecast of United Arab Emirates (in USD Bn)
- 6.60 Exhibit 6.60: Forecast of Saudi Arabia (in USD Bn)
- 6.61 Exhibit 6.61: Forecast of South Africa (in USD Bn)
- 6.62 Exhibit 6.62: Forecast of Rest of Middle East & Africa (in USD Bn)
- 6.63 Exhibit 6.63: Forecast of Latin America (in USD Bn)
- 6.64 Exhibit 6.64: Forecast of Brazil (in USD Bn)
- 6.65 Exhibit 6.65: Forecast of Mexico (in USD Bn)
- 6.66 Exhibit 6.66: Forecast of Rest of Latin America (in USD Bn)
Frequently asked questions
What is the size of the global defense industry?
How is the market size derived?
Which region leads the market?
How many companies and countries does this report cover?
Which segments grow fastest?
Who are the key companies profiled?
Research Methodology
All MarketResearchReports.com strategic research reports follow a rigorous, multi-stage methodology combining AI-assisted data synthesis with expert analyst validation.
Systematic collection from 500+ verified sources including SEC filings, industry databases (Bloomberg, Statista, OECD), regulatory filings, trade publications, patent databases, and company annual reports. AI-assisted extraction identifies relevant data points across 10,000+ documents per report.
Dual-validation approach: bottom-up sizing aggregates segment-level production, consumption, and trade data; top-down sizing cross-validates against macroeconomic indicators and total addressable market estimates. Discrepancies >5% trigger analyst review.
Company profiles built from public financial disclosures, product launches, M&A activity, job postings (as capability proxies), and supply chain mapping. Market share estimates triangulated across revenue, capacity, and shipment data.
CAGR projections use time-series regression on 5-10 years of historical data, adjusted for identified demand drivers (technology adoption curves, regulatory catalysts, demographic shifts) and demand inhibitors (cost barriers, substitution risk). Scenario modeling covers base, optimistic, and conservative cases.
All quantitative outputs reviewed by a domain-specialist analyst before publication. Data triangulation requires minimum 3 independent sources for every key figure. Reports undergo a structured peer review against our 47-point quality checklist covering methodology, data citations, logical consistency, and formatting standards.
On-demand reports are generated at time of purchase, incorporating the most recent available data. Static reports are republished when underlying market conditions shift by >10% from baseline assumptions. Purchasers receive update notifications for 12 months.
Related reports
 Navadhi Market Research · Aerospace & Defense
Global Defence Technology & Autonomous Systems Market Strategic Research Report
The Global Defence Technology & Autonomous Systems Market is undergoing a deep structural transformation, separating itself from traditional hardware production.…
Navadhi Market Research · Aerospace & DefenseSPCX: The $2 Trillion Question A Comprehensive Equity Research Report on the SpaceX IPO - Starlink, Starship, xAI, and the Case for the Largest Public Listing in History
SpaceX filed its IPO prospectus on May 20, 2026 — targeting a $1.75–$2.0 trillion valuation, an $80 billion raise, and a Nasdaq listing under SPCX as early as June 1…
Navadhi Market Research · Aerospace & DefenseGlobal Commercial Aviation MRO Strategic Research Report
The global commercial aviation MRO industry has fundamentally transitioned from a post-pandemic recovery phase into a structural "super cycle" that will redefine the…
Need a customized version?
Get country-, segment- or company-specific intelligence tailored to your exact requirements.
Request custom research →Request a free sample
Receive a sample of Global Defense Industry Strategic Research Report before you buy.
Customize This Report
Describe your specific requirements and our analysts will scope and deliver a tailored version.
Request Invoice
We will email a proforma invoice within 24 hours. Report access is granted upon payment confirmation.
Leading Brands in This Industry