

Global GLP-1 Market Strategic Intelligence Suite
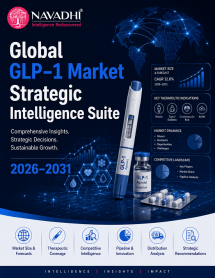
By Type: Consumption (Demand-Side), Production (Supply-Side)
By Application: Industry Report, Manufacturing Report, Executive Presentation, Summary Document, Infographic
Regional Forecast: Asia Pacific, Latin America, MEA, Europe, North America
Key Players: Eli Lilly and Company, Novo Nordisk A/S, Biocon Biologics, Amgen Inc., Viking Therapeutics, Zealand Pharma A/S, Hanmi Pharmaceutical Co., Roche / Genentech, Novo Holdings (via Catalent), Samsung Biologics, Lonza, WuXi Biologics
Overview
The Global GLP-1 Market Strategic Intelligence Suite 2026–2031 comprises two full-length strategic research reports viewed together for the first time - the Global GLP-1 Drug Market Report (demand-side) and the Global GLP-1 Drug Manufacturing & Supply Chain Market Report (supply-side) - plus this summary and accompanying presentation and infographic.
GLP-1 drugs (used for both type 2 diabetes and obesity/weight management) represent one of the fastest-growing and most capacity-constrained categories in global pharmaceuticals Industry Strategic Research Report">global pharmaceuticals. This suite covers both the demand side (drug market revenue, product-level competitive dynamics, indication mix) and the supply side (manufacturing capacity, peptide synthesis, CDMO landscape) in a single integrated resource.
The Global GLP-1 Drug Market Report (demand-side) was valued at $70.58 billion in 2025 and is projected to reach $145.39 billion by 2031, a CAGR of 12.8%. The report's single most consequential finding is a real, ongoing competitive leadership reversal: Eli Lilly's tirzepatide franchise overtook Novo Nordisk's semaglutide franchise for US market leadership during 2025, reaching an estimated 57% US market share, with Eli Lilly's market capitalisation crossing $1 trillion in August 2026 - the first healthcare company in history to do so.
The Global GLP-1 Drug Manufacturing & Supply Chain Market Report (supply-side) was valued at $45.0 billion in 2025 and is projected to reach $180.0 billion by 2031, a CAGR of 26.0% - roughly double the demand-side rate. Both Eli Lilly and Novo Nordisk have publicly confirmed manufacturing capacity, not demand, as the binding constraint on patient access, and a real, quantified reshoring wave is underway: of $24.86 billion in total 2025 CDMO capacity investment, approximately 74% ($18.48 billion) was directed to US and non-China facilities.
2. The Core Finding: A Capacity-Constrained Market
The GLP-1 category shows one of the widest demand/supply growth-rate divergences of any pharmaceutical sub-sector currently tracked - manufacturing capacity value is forecast to overtake drug-market revenue by 2031. Three structural factors explain this: peptide synthesis complexity requiring years of fermentation-capacity build-out, dual-indication demand (diabetes + obesity) compounding volume faster than any comparable recent drug class, and strategic multi-billion-dollar capacity investment specifically targeting the demand-supply gap.
Suite Components
| Component | Content |
|---|---|
| Report 1: Drug Market | Drug revenue, product-level competitive dynamics (tirzepatide/semaglutide), indication split, regional forecasts |
| Report 2: Manufacturing & Supply Chain | Manufacturing capacity, peptide/fermentation production, CDMO landscape, reshoring investment |
| Executive Presentation | 12-slide integrated comparative presentation |
| Summary Document (DOCX) | Integrated executive summary of both reports' headline and deep findings |
| Interactive Infographic (HTML) | Visual one-page infographic for digital distribution |
Please Note: individual reports can also be purchased separately based on your specific data needs.
Market snapshot
Global GLP-1 Market Strategic Intelligence Suite snapshot, 2025–2031
 © MarketResearchReports.comDisclaimer: The actual data may vary in the final report which undergoes verification check post order confirmation.
Segments covered in this report
Table of contents
01Global GLP-1 Market Strategic Intelligence Suite — Overview
- Suite Introduction: The Global GLP-1 Value Chain 2026–2031
- How the Two Reports Interconnect: Manufacturing Capacity vs. Drug Market Revenue
- Suite Bonus Deliverables: Executive Presentation, Summary Document, and Infographic
02Report 1: Global GLP-1 Drug Market Strategic Research Report 2026–2031 (Demand-Side)
03Executive Summary
- 1.1 Market Positioning Statement
- 1.2 Market Sizing and Forecast Overview
- 1.3 The Competitive Landscape: A Leadership Reversal in Real Time
- 1.4 Market Segmentation Overview
- 1.5 Primary Growth Drivers and Inhibitors
- 1.6 Strategic Implications
04Industry Overview & Forecast
- 2.1 Market Scale and Historical Trajectory
- 2.2 Forecast Structure and Growth Rate Assumptions
- 2.3 Market Segmentation by Product Type
- 2.4 Market Segmentation by Application
- 2.5 Regional Market Dynamics
- 2.6 Transition from Early-Launch to Maturity Phase
05Market Segmentation by Type
- 3.1 Overview and Segment Architecture
- 3.2 Tirzepatide (Mounjaro/Zepbound)
- 3.3 Semaglutide Injectable (Ozempic/Wegovy)
- 3.4 Oral Semaglutide (Rybelsus)
- 3.5 GLP-1 Biosimilars and Emerging Pipeline
- 3.6 Dulaglutide (Trulicity) — Legacy Segment in Structural Decline
- 3.7 Segment Synthesis and Competitive Positioning
06Market Segmentation by Application
- 4.1 Application Landscape Overview
- 4.2 Type 2 Diabetes
- 4.3 Obesity and Weight Management
- 4.4 Cardiovascular Risk Reduction
- 4.5 Chronic Kidney Disease
- 4.6 Other Emerging Applications
- 4.7 Application Segmentation
07Regional Market Forecast
- 5.1 North America
- 5.2 Europe
- 5.3 Asia Pacific
- 5.4 Latin America
- 5.5 MEA
08Country-Level Market Forecast
- 6.1 North America
- 6.1.1 United States
- 6.1.2 Canada
- 6.2 Europe
- 6.2.1 Germany
- 6.2.2 United Kingdom
- 6.2.3 France
- 6.2.4 Italy
- 6.2.5 Spain
- 6.2.6 Rest of Europe
- 6.3 Asia Pacific
- 6.3.1 Japan
- 6.3.2 China
- 6.3.3 South Korea
- 6.3.4 India
- 6.3.5 Australia
- 6.3.6 Rest of Asia Pacific
- 6.4 Latin America
- 6.4.1 Brazil
- 6.4.2 Mexico
- 6.4.3 Argentina
- 6.4.4 Colombia
- 6.4.5 Rest of Latin America
- 6.5 MEA
- 6.5.1 Saudi Arabia
- 6.5.2 United Arab Emirates
- 6.5.3 South Africa
- 6.5.4 Turkey
- 6.5.5 Rest of MEA
09Growth Drivers & Inhibitors
- 7.1 Overview
- 7.2 Primary Growth Drivers
- 7.2.1 Accelerating Indication Expansion Beyond Core Metabolic Disease
- 7.2.2 Oral Formulation Development Structurally Expanding the Addressable Patient Population
- 7.2.3 Manufacturing Capacity Expansion Resolving Structural Supply Constraints
- 7.3 Primary Market Inhibitors
- 7.3.1 US Government Pricing Interventions Compressing Per-Unit Revenue
- 7.3.2 Medicare Part D Negotiated Pricing Introducing Sustained Structural Pricing Pressure
- 7.3.3 Compounded and Unauthorised GLP-1 Products Eroding Cash-Pay Revenue
- 7.3.4 Biosimilar and Generic Entry Compressing Average Selling Prices Across the Category
- 7.4 Net Assessment
- Global GLP-1 Drug Market Strategic Research Report 2026-2031
10Key Company Profiles
- 8.1 Eli Lilly and Company
- 8.1.1 Company Overview
- 8.1.2 Key Products & Segments
- 8.1.3 Financial Performance (2023–2025)
- 8.1.4 Business Strategy
- 8.1.5 SWOT Analysis
- 8.1.6 Strategic Implications (2025–2031)
- 8.2 Novo Nordisk A/S
- 8.2.1 Company Overview
- 8.2.2 Key Products & Segments
- 8.2.3 Financial Performance (2023–2025)
- 8.2.4 Business Strategy
- 8.2.5 SWOT Analysis
- 8.2.6 Strategic Implications (2025–2031)
- 8.3 Biocon Biologics Limited
- 8.3.1 Company Overview
- 8.3.2 Key Products & Segments
- 8.3.3 Financial Performance (2023–2025)
- 8.3.4 Business Strategy
- 8.3.5 SWOT Analysis
- 8.3.6 Strategic Implications (2025–2031)
- 8.4 Amgen Inc.
- 8.4.1 Company Overview
- 8.4.2 Key Products & Segments
- 8.4.3 Financial Performance (2023–2025)
- 8.4.4 Business Strategy
- 8.4.5 SWOT Analysis
- 8.4.6 Strategic Implications (2025–2031)
- 8.5 Viking Therapeutics
- 8.5.1 Company Overview
- 8.5.2 Key Products & Segments
- 8.5.3 Financial Performance (2023–2025)
- 8.5.4 Business Strategy
- 8.5.5 SWOT Analysis
- 8.5.6 Strategic Implications (2025–2031)
- 8.6 Zealand Pharma A/S
- 8.6.1 Company Overview
- 8.6.2 Key Products & Segments
- 8.6.3 Financial Performance (2023–2025)
- 8.6.4 Business Strategy
- 8.6.5 SWOT Analysis
- 8.6.6 Strategic Implications (2025–2031)
- 8.7 Hanmi Pharmaceutical Co.
- 8.7.1 Company Overview
- 8.7.2 Key Products & Segments
- 8.7.3 Financial Performance (2023–2025)
- 8.7.4 Business Strategy
- 8.7.5 SWOT Analysis
- 8.7.6 Strategic Implications (2025–2031)
- 8.8 Roche / Genentech
- 8.8.1 Company Overview
- 8.8.2 Key Products & Segments
- 8.8.3 Financial Performance (2023–2025)
- 8.8.4 Business Strategy
- Global GLP-1 Drug Market Strategic Research Report 2026-2031
- 8.8.5 SWOT Analysis
- 8.8.6 Strategic Implications (2025–2031)
11Competitive Landscape
- 9.1 Competitive Landscape Overview
- 9.2 Competitive Intensity Assessment
- 9.2.1 Tier Structure and Revenue Ranges
- 9.2.2 Capacity vs. Demand Dynamics
- 9.2.3 Pricing Environment
- 9.2.4 Barriers to Entry and Exit
- 9.3 Key Player Strategies & Positioning
- 9.4 Competitive Dynamics & Strategic Outlook
- 9.4.1 The Duopoly Under Siege
- 9.4.2 Competitive Threat Matrix: Entrant Profiles and Entry Timelines
- 9.4.3 Emerging Competitive Threats: Three Distinct Vectors
- 9.4.4 Consolidation Versus Fragmentation Outlook
- 9.4.5 Strategic Recommendations: 2025–2031
12Porter's Five Forces Analysis
- 10.1 Threat of New Entrants
- 10.2 Bargaining Power of Buyers
- 10.3 Bargaining Power of Suppliers
- 10.4 Threat of Substitutes
- 10.5 Competitive Rivalry
13PESTLE Analysis
- 11.1 Overview
- 11.2 Political
- 11.2.1 Government Drug Pricing Intervention
- 11.2.2 Medicare Part D Negotiated Pricing
- 11.2.3 International Affordability and Access Policy
- 11.2.4 Political Risk in Emerging Markets
- 11.2.5 Summary Assessment
- 11.3 Economic
- 11.3.1 Market Scale and Growth Trajectory
- 11.3.2 Affordability and Payer Economics
- 11.3.3 Price Reduction and Volume Dynamics
- 11.3.4 Currency Dynamics and Novo Nordisk Exposure
- 11.3.5 R&D Investment Economics
- 11.3.6 Biosimilar Economics
- 11.3.7 Macroeconomic Sensitivity
- 11.4 Societal
- 11.4.1 Global Obesity Epidemic as Structural Demand Driver
- 11.4.2 Stigma Reduction and Patient Empowerment
- 11.4.3 Health Equity and Access Disparities
- 11.4.4 Shifting Perceptions of Weight Loss Treatment
- 11.4.5 Ageing Demographics
- 11.4.6 Physician Prescribing Culture
- 11.5 Technological
- 11.5.1 Tirzepatide's Dual-Agonist Innovation
- 11.5.2 Oral GLP-1 Formulation Development
- 11.5.3 Triple and Multi-Receptor Agonist Development
- 11.5.4 Manufacturing Technology and Capacity
- 11.5.5 Delivery Technology Innovation
- 11.5.6 AI and Digital Health Integration
- 11.5.7 Biosimilar Technology Complexity
- Global GLP-1 Drug Market Strategic Research Report 2026-2031
- 11.6 Legal
- 11.6.1 Intellectual Property Landscape
- 11.6.2 Patent Litigation
- 11.6.3 Regulatory Approval and Label Expansion Litigation
- 11.6.4 Product Liability
- 11.6.5 Antitrust and Competition Law
- 11.6.6 Data Privacy in Digital Health Integration
- 11.7 Environmental
- 11.7.1 Manufacturing Carbon Footprint
- 11.7.2 Pharmaceutical Waste and Environmental Contamination
- 11.7.3 Climate Resilience of Supply Chains
- 11.7.4 Packaging and Cold Chain Sustainability
- 11.7.5 Environmental Drivers of Chronic Disease
- 11.7.6 ESG-Linked Capital Allocation
- 11.8 PESTLE Synthesis and Strategic Implications
14SWOT Analysis
- 12.1 Strategic Framework Overview
- 12.2 Strengths
- 12.2.1 Validated, Expanding Clinical Efficacy Profile
- 12.2.2 Incumbent Commercial Infrastructure at Scale
- 12.2.3 Manufacturing Scale as a Structural Moat
- 12.2.4 Category-Level Brand Recognition and Patient Pull
- 12.3 Weaknesses
- 12.3.1 Pricing Vulnerability and Reimbursement Dependency
- 12.3.2 Manufacturing Complexity and Yield Constraints
- 12.3.3 Patient Discontinuation and Adherence Dynamics
- 12.3.4 Duopoly Concentration Risk
- 12.4 Opportunities
- 12.4.1 Indication Expansion Across Metabolic and Cardiometabolic Disease
- 12.4.2 Oral Formulation Development and Route Diversification
- 12.4.3 Emerging Market Penetration
- 12.4.4 Combination Therapy and Precision Medicine Positioning
- 12.4.5 Digital Health and Adherence Platform Integration
- 12.5 Threats
- 12.5.1 Biosimilar and Generic Entry Pressure
- 12.5.2 Regulatory and Policy Pricing Intervention
- 12.5.3 Pipeline Competitive Entry from Well-Capitalised Challengers
- 12.5.4 Safety Signal Risk and Pharmacovigilance Exposure
- 12.5.5 Compounding and Unauthorised Substitution
- 12.6 SWOT Synthesis and Strategic Implications
15Future Trends & Outlook
- 13.1 Executive Summary of the Outlook
- 13.2 Pricing Reform and Policy Headwinds
- 13.3 Indication Expansion: The Platform Medicine Transformation
- 13.4 The Oral GLP-1 Revolution: Format Disruption and Access Expansion
- 13.5 Biosimilar and Competitive Entry
- 13.6 Regional Outlook
- 13.7 Technology and Delivery Innovation: The Next Competitive Frontier
- 13.8 Competitive Strategy Implications: Eli Lilly versus Novo Nordisk
- 13.9 Key Risks and Scenarios to the Forecast
- 13.10 Strategic Conclusions for Market Participants
16Report 2: Global GLP-1 Drug Manufacturing & Supply Chain Market Strategic Research Report 2026–2031 (Supply-Side)
17Executive Summary
- 1.1 Market Sizing and Forecast Overview
- 1.2 Important Methodological Note: Cross-Report Reconciliation
- 1.3 Manufacturing Value Chain Segmentation
- 1.4 Regional Manufacturing Distribution
- 1.5 Principal Growth Drivers
- 1.6 Principal Market Inhibitors
- 1.7 Competitive Landscape Overview
- 1.8 Strategic Conclusions
18Industry Overview & Forecast
- 2.1 Market Scale and Historical Trajectory
- 2.2 Methodology Note and Cross-Report Reconciliation Flag
- 2.3 Forecast: 2026–2031 Outlook
- 2.4 Value Chain Segmentation
- 2.5 Regional Distribution and Growth Dynamics
- 2.6 Summary Assessment
19Market Segmentation by Type
- 3.1 Overview of the GLP-1 Manufacturing Value Chain
- 3.2 Drug Product Formulation and Fill-Finish
- 3.3 Delivery Device Manufacturing
- 3.4 GLP-1 API Peptide Synthesis (CDMO)
- 3.5 Primary Packaging and Containment
- 3.6 Cold Chain and Temperature-Controlled Logistics
- 3.7 Testing, Quality Control, and Regulatory Services
- 3.8 Comparative Segment Summary and Share Dynamics
20Market Segmentation by Application
- 4.1 Overview of the GLP-1 Manufacturing Value Chain
- 4.2 Segment 1: GLP-1 API Peptide Synthesis (CDMO)
- 4.2.1 Segment Definition and Scope
- 4.2.2 Market Size and Growth Trajectory
- 4.2.3 Competitive Landscape and Capacity Dynamics
- 4.2.4 Strategic Trends and Forward-Looking Analysis
- 4.3 Segment 2: Drug Product Formulation and Fill-Finish
- 4.3.1 Segment Definition and Scope
- 4.3.2 Market Size and Growth Trajectory
- 4.3.3 Competitive Landscape and Capacity Dynamics
- 4.3.4 Strategic Trends and Forward-Looking Analysis
- 4.4 Segment 3: Delivery Device Manufacturing
- 4.4.1 Segment Definition and Scope
- 4.4.2 Market Size and Growth Trajectory
- 4.4.3 Competitive Landscape and Capacity Dynamics
- 4.4.4 Strategic Trends and Forward-Looking Analysis
- 4.5 Segment 4: Primary Packaging and Containment
- 4.5.1 Segment Definition and Scope
- 4.5.2 Market Size and Growth Trajectory
- 4.5.3 Competitive Landscape and Capacity Dynamics
- 4.5.4 Strategic Trends and Forward-Looking Analysis
- 4.6 Segment 5: Cold Chain and Temperature-Controlled Logistics
- 4.6.1 Segment Definition and Scope
- Global GLP-1 Drug Manufacturing & Supply Chain Market Strategic Research Report 2026-2031
- 4.6.2 Market Size and Growth Trajectory
- 4.6.3 Competitive Landscape and Capacity Dynamics
- 4.6.4 Strategic Trends and Forward-Looking Analysis
- 4.7 Segment 6: Testing, Quality Control, and Regulatory Services
- 4.7.1 Segment Definition and Scope
- 4.7.2 Market Size and Growth Trajectory
- 4.7.3 Competitive Landscape and Capacity Dynamics
- 4.7.4 Strategic Trends and Forward-Looking Analysis
- 4.8 Cross-Segment Integration and Strategic Observations
- 4.8.1 Value Chain Concentration and Bottleneck Analysis
- 4.8.2 Segment Share Evolution Through 2031
- 4.8.3 Capital Investment Signals and their Segmental Implications
21Regional Market Forecast
- 5.1 North America
- 5.2 Europe
- 5.3 Asia Pacific
- 5.4 Middle East & Africa
- 5.5 Latin America
22Country-Level Market Forecast
- 6.1 North America
- 6.1.1 United States
- 6.1.2 Puerto Rico (US)
- 6.1.3 Canada
- 6.2 Europe
- 6.2.1 Ireland
- 6.2.2 Switzerland
- 6.2.3 Germany
- 6.2.4 Denmark
- 6.2.5 Belgium
- 6.2.6 Rest of Europe
- Global GLP-1 Drug Manufacturing & Supply Chain Market Strategic Research Report 2026-2031
- 6.3 Asia Pacific
- 6.3.1 South Korea
- 6.3.2 China
- 6.3.3 India
- 6.3.4 Japan
- 6.3.5 Rest of Asia Pacific
- 6.4 Middle East & Africa
- 6.4.1 Saudi Arabia
- 6.4.2 United Arab Emirates
- 6.4.3 South Africa
- 6.4.4 Egypt
- 6.4.5 Rest of MEA
- 6.5 Latin America
- 6.5.1 Brazil
- 6.5.2 Mexico
- 6.5.3 Argentina
- 6.5.4 Colombia
- 6.5.5 Rest of LatAm
23Growth Drivers & Inhibitors
- 7.1 Overview
- 7.2 Growth Drivers
- 7.2.1 Manufacturer-Confirmed Capacity Constraint as the Primary Demand Limiter
- 7.2.2 Quantified Reshoring-Driven Capital Investment Wave
- 7.2.3 Indication Expansion Systematically Broadening the Addressable Patient Population
- 7.3 Market Inhibitors
- 7.3.1 Multi-Year Capital Lead Times Creating Demand-Supply Mismatch Risk
- 7.3.2 Geopolitical and Export-Control Disruption to Chinese CDMO Capacity
- 7.4 Composite Driver-Inhibitor Assessment
24Key Company Profiles
- 8.1 Eli Lilly and Company
- 8.1.1 Company Overview
- 8.1.2 Key Products & Segments
- 8.1.3 Financial Performance (2023–2025)
- 8.1.4 Business Strategy
- 8.1.5 SWOT Analysis
- 8.1.6 Strategic Implications (2025–2031)
- 8.2 Novo Nordisk A/S
- 8.2.1 Company Overview
- 8.2.2 Key Products & Segments
- 8.2.3 Financial Performance (2023–2025)
- 8.2.4 Business Strategy
- 8.2.5 SWOT Analysis
- 8.2.6 Strategic Implications (2025–2031)
- 8.3 Novo Holdings (via Catalent)
- 8.3.1 Company Overview
- 8.3.2 Key Products & Segments
- 8.3.3 Financial Performance (2023–2025)
- 8.3.4 Business Strategy
- 8.3.5 SWOT Analysis
- 8.3.6 Strategic Implications (2025–2031)
- 8.4 Samsung Biologics
- 8.4.1 Company Overview
- 8.4.2 Key Products & Segments
- 8.4.3 Financial Performance (2023–2025)
- 8.4.4 Business Strategy
- Global GLP-1 Drug Manufacturing & Supply Chain Market Strategic Research Report 2026-2031
- 8.4.5 SWOT Analysis
- 8.4.6 Strategic Implications (2025–2031)
- 8.5 Lonza
- 8.5.1 Company Overview
- 8.5.2 Key Products & Segments
- 8.5.3 Financial Performance (2023–2025)
- 8.5.4 Business Strategy
- 8.5.5 SWOT Analysis
- 8.5.6 Strategic Implications (2025–2031)
- 8.6 WuXi Biologics
- 8.6.1 Company Overview
- 8.6.2 Key Products & Segments
- 8.6.3 Financial Performance (2023–2025)
- 8.6.4 Business Strategy
- 8.6.5 SWOT Analysis
- 8.6.6 Strategic Implications (2025–2031)
- 8.7 Biocon Biologics
- 8.7.1 Company Overview
- 8.7.2 Key Products & Segments
- 8.7.3 Financial Performance (2023–2025)
- 8.7.4 Business Strategy
- 8.7.5 SWOT Analysis
- 8.7.6 Strategic Implications (2025–2031)
25Competitive Landscape
- 9.1 Competitive Landscape Overview
- 9.1.1 Market Structure and Concentration
- 9.1.2 Estimated Market Share by Leading Player (2025)
- 9.1.3 Herfindahl-Hirschman Index and Concentration Assessment
- 9.1.4 Overall Competitive Intensity Rating: Low to Moderate
- 9.2 Competitive Intensity Assessment
- 9.2.1 Tier Classification and Revenue Positioning
- 9.2.2 Tier 1
- 9.2.3 Tier 2
- 9.2.4 Tier 3
- 9.2.5 Barriers to Entry and Exit
- 9.3 Key Player Strategies & Positioning
- 9.3.1 Strategic Group Positioning Narrative
- 9.3.2 M&A and Partnership Activity Summary (2022–Present)
- 9.3.3 Differentiation Strategies and Geographic Strongholds
- 9.3.4 R&D and Technology Investment Trends
- 9.4 Competitive Dynamics & Strategic Outlook
- 9.4.1 Emerging Competitive Threats & New Entrant Landscape
- 9.4.2 Consolidation vs. Fragmentation Outlook
- 9.4.3 Competitive Response Matrix
- 9.4.4 Strategic Recommendations for 2025–2031
26Porter's Five Forces Analysis
- 10.1 Threat of New Entrants
- 10.2 Bargaining Power of Buyers
- 10.3 Bargaining Power of Suppliers
- 10.4 Threat of Substitutes
- 10.5 Competitive Rivalry
27PESTLE Analysis
- 11.1 Overview
- 11.2 Political
- Global GLP-1 Drug Manufacturing & Supply Chain Market Strategic Research Report 2026-2031
- 11.2.1 Reshoring Policy and Manufacturing Nationalism
- 11.2.2 Geopolitical Fragmentation and Chinese CDMO Risk
- 11.2.3 Regulatory and Trade Policy Influence on Market Access
- 11.3 Economic
- 11.3.1 Extraordinary Capital Investment Intensity
- 11.3.2 Demand-Supply Mismatch Risk and Pricing Dynamics
- 11.3.3 CDMO Consolidation Economics
- 11.4 Sociocultural
- 11.4.1 The Obesity and Metabolic Disease Burden as Market Foundation
- 11.4.2 Patient Advocacy and Access Equity Pressure
- 11.4.3 Workforce and Specialised Talent Dynamics
- 11.5 Technological
- 11.5.1 Peptide Synthesis and Biologics Manufacturing Complexity
- 11.5.2 Delivery Device Technology and Integration Complexity
- 11.5.3 Digital Supply Chain and Serialisation Technologies
- 11.5.4 Biosimilar and Generic Entry Technology Dynamics
- 11.6 Legal
- 11.6.1 Regulatory Approval Pathways and Market Exclusivity
- 11.6.2 Biosimilar Regulatory Frameworks and Litigation Risk
- 11.6.3 Export Controls and Trade Compliance
- 11.6.4 Quality Regulatory Compliance and GMP Standards
- 11.7 Environmental
- 11.7.1 Energy Intensity of Pharmaceutical Manufacturing at Scale
- 11.7.2 Cold Chain Logistics and Carbon Footprint
- 11.7.3 Waste Generation and Pharmaceutical Environmental Impact
- 11.7.4 Site Selection and Environmental Permitting
- 11.8 PESTLE Summary Assessment
28SWOT Analysis
- 12.1 Executive Overview
- 12.2 Strengths
- 12.2.1 Demand Signal of Unprecedented Clarity and Scale
- 12.2.2 Massive and Accelerating Capital Commitments by Market Leaders
- 12.2.3 Highly Specialised Technical Barriers to Entry Protecting Incumbents
- 12.2.4 Established Regulatory Approval Infrastructure at Key Manufacturing Geographies
- 12.2.5 Integrated Value Chain Depth Creating Cross-Segment Capture Opportunities
- 12.3 Weaknesses
- 12.3.1 Severe Concentrated Supply Risk Within a Small Number of Organisations and Sites
- 12.3.2 Cold Chain and Temperature-Controlled Logistics Infrastructure Gaps
- 12.3.3 Device Manufacturing Complexity and Component Supply Constraints
- 12.3.4 Geopolitical Exposure Through WuXi Biologics and Chinese CDMO Dependency
- 12.3.5 Cross-Report Data Reconciliation Gap Reflecting Market Sizing Uncertainty
- 12.4 Opportunities
- 12.4.1 Biosimilar Entry Window Creating Transformative CDMO Demand Through 2026–2031
- 12.4.2 Asia-Pacific Manufacturing Share Expansion Driven by South Korea and India
- 12.4.3 Pipeline Expansion Beyond Obesity and Diabetes Into Adjacent Cardiovascular, Renal, and Neurological Indications
- 12.4.4 Oral GLP-1 Formulations Creating New Formulation and Delivery Manufacturing Segments
- 12.4.5 Middle East and Africa Strategic Investment as Regional Manufacturing Hubs Emerge
- 12.4.6 Digital Manufacturing, Continuous Processing, and Process Intensification as Efficiency Multipliers
- 12.5 Threats
- 12.5.1 Regulatory and Political Risk From Drug Pricing Legislation and Import Policy
- 12.5.2 Geopolitical Fragmentation Creating Dual Manufacturing System Requirements
- 12.5.3 Sustained Capacity Shortfall Damaging Market Trust and Accelerating Biosimilar Entry
- 12.5.4 Environmental and Solvent Waste Regulatory Tightening Threatening Synthesis Economics
- 12.5.5 Intellectual Property Litigation Risk Creating Biosimilar Entry Uncertainty
- Global GLP-1 Drug Manufacturing & Supply Chain Market Strategic Research Report 2026-2031
- 12.5.6 Data Integrity and Quality System Failures at Scale Creating Regulatory Jeopardy
- 12.6 Integrated SWOT Assessment and Strategic Implications
29Future Trends & Outlook
- 13.1 Executive Summary of Forward-Looking Dynamics
- 13.2 Market Scale and Trajectory Through 2031
- 13.3 Value Chain Evolution: Segment-Level Outlook
- 13.3.1 API Peptide Synthesis
- 13.3.2 Drug Product Formulation and Fill-Finish
- 13.3.3 Delivery Device Manufacturing
- 13.3.4 Primary Packaging and Containment
- 13.3.5 Cold Chain and Temperature-Controlled Logistics
- 13.3.6 Testing, Quality Control, and Regulatory Services
- 13.4 Regional Outlook and Geographic Competitive Dynamics
- 13.4.1 North America
- 13.4.2 Europe
- 13.4.3 Asia Pacific
- 13.4.4 Middle East, Africa, and Latin America
- 13.5 Biosimilar Entry and the Competitive Restructuring of the Supply Chain
- 13.6 Technology Trends Reshaping Manufacturing Capability
- 13.6.1 Continuous Manufacturing and Process Intensification
- 13.6.2 Artificial Intelligence in Quality Control and Supply Chain Management
- 13.6.3 Oral Formulation Technology
- 13.7 Supply Chain Resilience and Geopolitical Risk Dimensions
- 13.7.1 Geographic Concentration Risk
- 13.7.2 Geopolitical Fragmentation of CDMO Supply Chains
- 13.7.3 Raw Material and Critical Input Security
- 13.8 Investment and Capacity Expansion Outlook
- 13.
30Suite Bonus Deliverables
- Executive Presentation — A 12-slide cross-report visual summary synthesising key findings, market sizes, growth rates, the tirzepatide/semaglutide leadership reversal, and the manufacturing capacity-constraint linkage across both reports.
- Cross-Report Summary Document — A structured summary explaining how the Manufacturing and Drug Market reports interconnect across the GLP-1 value chain, with a publisher's methodology note.
- Interactive Infographic — A high-impact visual infographic presenting the key headline data from both markets for executive briefings and stakeholder communication.
Frequently asked questions
What is included in the Global GLP-1 Market Strategic Intelligence Suite?
What is the combined market size covered by this suite?
Why is GLP-1 manufacturing capacity growing so much faster than drug revenue?
What is the tirzepatide/semaglutide leadership reversal?
Can I purchase the individual reports separately?
Research Methodology
All MarketResearchReports.com strategic research reports follow a rigorous, multi-stage methodology combining AI-assisted data synthesis with expert analyst validation.
Systematic collection from 500+ verified sources including SEC filings, industry databases (Bloomberg, Statista, OECD), regulatory filings, trade publications, patent databases, and company annual reports. AI-assisted extraction identifies relevant data points across 10,000+ documents per report.
Dual-validation approach: bottom-up sizing aggregates segment-level production, consumption, and trade data; top-down sizing cross-validates against macroeconomic indicators and total addressable market estimates. Discrepancies >5% trigger analyst review.
Company profiles built from public financial disclosures, product launches, M&A activity, job postings (as capability proxies), and supply chain mapping. Market share estimates triangulated across revenue, capacity, and shipment data.
CAGR projections use time-series regression on 5-10 years of historical data, adjusted for identified demand drivers (technology adoption curves, regulatory catalysts, demographic shifts) and demand inhibitors (cost barriers, substitution risk). Scenario modeling covers base, optimistic, and conservative cases.
All quantitative outputs reviewed by a domain-specialist analyst before publication. Data triangulation requires minimum 3 independent sources for every key figure. Reports undergo a structured peer review against our 47-point quality checklist covering methodology, data citations, logical consistency, and formatting standards.
On-demand reports are generated at time of purchase, incorporating the most recent available data. Static reports are republished when underlying market conditions shift by >10% from baseline assumptions. Purchasers receive update notifications for 12 months.
Related reports
 Navadhi Market Research · Pharmaceuticals
Global Peptide Market Strategic Intelligence Suite
The Global Peptide Market Strategic Intelligence Suite 2026–2031 is Navadhi Market Research's most comprehensive intelligence offering on the global peptide industry…
Navadhi Market Research · PharmaceuticalsGlobal Oncology Market Strategic Research Report
The global oncology market is undergoing a historic structural transformation driven by three simultaneous pharmaceutical supercycles - the immunotherapy/checkpoint …
Navadhi Market Research · PharmaceuticalsGlobal Peptide Therapy Market Strategic Research Report
The global peptide therapy market is undergoing an unprecedented structural transformation driven by the GLP-1 revolution - the extraordinary commercial success of G…
Need a customized version?
Get country-, segment- or company-specific intelligence tailored to your exact requirements.
Request custom research →Request a free sample
Receive a sample of Global GLP-1 Market Strategic Intelligence Suite before you buy.
Customize This Report
Describe your specific requirements and our analysts will scope and deliver a tailored version.
Request Invoice
We will email a proforma invoice within 24 hours. Report access is granted upon payment confirmation.
Leading Brands in This Industry





