Global Humanoid Robot E-Skin Market Strategic Research Report
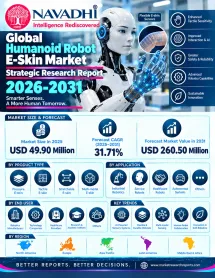
By Type: Piezoresistive, Capacitive, Optical and Vision-Based, Magnetic and Hall-Effect, Textile, Piezoelectric and Other
By Application: Research, Education and Data Collection, Industrial and Manufacturing, Logistics and Warehousing, Service, Healthcare and Entertainment
Regional Forecast: Asia Pacific, Latin America, MEA, Europe, North America
Key Players: PaXini Tech, Tashan Technology, XELA Robotics, GelSight, Touchlab, Contactile, Daimon Robotics, BeBop Sensors, Tekscan, Interlink Electronics
Overview
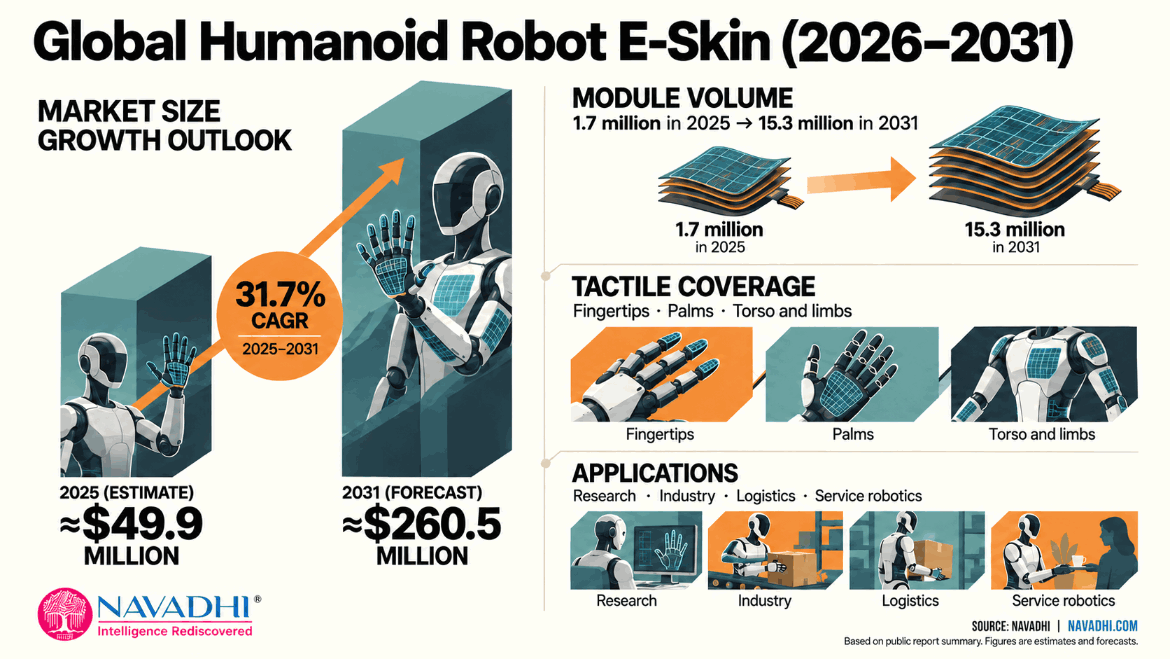
The global humanoid robot e-skin market is estimated at US$49.9 million in 2025 and is forecast to reach US$260.5 million by 2031, a compound annual growth rate (CAGR) of 31.7% over 2025-2031. Volume is estimated at about 1.7 million modules in 2025, rising to about 15.3 million in 2031. The 2025 base blends a bottom-up channel build (US$37 million) with a 10% weight on the median of published estimates (US$167.5 million). No audited industry sales series exists and published sizes conflict, so confidence in the absolute base is low; the direction of growth is better supported. Bear and bull cases for 2031 are US$196.3 million (25.6% CAGR) and US$344.0 million (38.0% CAGR).
Humanoid robot e-skin is the flexible electronic skin and tactile sensing layer that gives humanoid robots a sense of touch: tactile modules on fingertips and fingers, array sensors on palms and hand surfaces, and large-area skin patches on the torso, arms, legs and feet, sold together with their readout electronics. Value is manufacturer-level revenue in US dollars; volume is tactile sensing modules.
Scope of the Global Humanoid Robot E-Skin Market Strategic Research Report
This report covers market value (US$ million) and module volume (million modules) for 2022-2031, with 2025 as the base year and 2026-2031 as the forecast period. It analyses five sensing technologies, four deployment segments, five regions and 24 named countries (plus rest-of-region groupings), and profiles 10 companies. Complete robots, dexterous hands sold as hands, joint torque and six-axis force sensors, cameras, software and datasets are excluded.
Segment by Type
- Piezoresistive
- Capacitive
- Optical and Vision-Based
- Magnetic and Hall-Effect
- Textile, Piezoelectric and Other
Segment by Application
- Research, Education and Data Collection
- Industrial and Manufacturing
- Logistics and Warehousing
- Service, Healthcare and Entertainment
Segment by Region
- North America (United States, Canada, Mexico, Rest of North America)
- Europe (Germany, United Kingdom, France, Switzerland, Netherlands, Italy, Rest of Europe)
- Asia Pacific (China, Japan, South Korea, Singapore, India, Australia, Rest of Asia Pacific)
- Latin America (Brazil, Chile, Colombia, Argentina, Rest of Latin America)
- Middle East and Africa (United Arab Emirates, Saudi Arabia, Israel, South Africa, Turkey, Rest of Middle East and Africa)
Who Can Use This Report?
- Tactile sensor and e-skin makers benchmarking the market, its technologies and pricing
- Humanoid robot and dexterous-hand developers planning tactile sensing sourcing
- Textile, materials and electronics suppliers assessing entry into robot skin
- Investors and research institutions needing a transparent, source-based view of an early market
Market snapshot
Global Humanoid Robot E-Skin Market Strategic Research Report snapshot, 2025–2031
 © MarketResearchReports.comDisclaimer: The actual data may vary in the final report which undergoes verification check post order confirmation.
Segments covered in this report
Table of contents
01Executive Summary
- 1.1.1 Market Definition and Sizing
- 1.1.2 Principal Growth Drivers
- 1.1.3 Segmentation Highlights
- 1.1.4 Competitive Structure
- 1.1.5 Principal Risks and Restraints
- 1.1.6 Closing Outlook
02Industry Overview & Forecast
- 2.1 Market Definition and Scope
- 2.2 Market Size and Historical Performance
- 2.3 Forecast and Growth Logic
- 2.4 Volume Analysis
- 2.5 Value Chain and Pricing Dynamics
03Market Segmentation by Type
- 3.1 Overview of the Type Segmentation Framework
- 3.2 Volume Analysis
- 3.2.1 Global Module Volume: Year-by-Year Trend
- 3.3 Piezoresistive Sensors
- 3.3.1 Definition and Applications
- 3.3.2 Market Size and Share
- 3.3.3 Growth Outlook
- 3.3.4 Demand Drivers, Technology, and Key Suppliers
- 3.4 Capacitive Sensors
- 3.4.1 Definition and Applications
- 3.4.2 Market Size and Share
- 3.4.3 Growth Outlook
- 3.4.4 Demand Drivers, Technology, and Key Suppliers
- 3.5 Optical and Vision-Based Sensors
- 3.5.1 Definition and Applications
- 3.5.2 Market Size and Share
- 3.5.3 Growth Outlook
- 3.5.4 Demand Drivers, Technology, and Key Suppliers
- 3.6 Magnetic and Hall-Effect Sensors
- 3.6.1 Definition and Applications
- 3.6.2 Market Size and Share
- 3.6.3 Growth Outlook
- 3.6.4 Demand Drivers, Technology, and Key Suppliers
- 3.7 Textile, Piezoelectric and Other Sensors
- 3.7.1 Definition and Applications
- 3.7.2 Market Size and Share
- 3.7.3 Growth Outlook
- 3.7.4 Demand Drivers, Technology, and Key Suppliers
- 3.8 Comparative Mix Shift and Technology Transition Dynamics
04Market Segmentation by Application
- 4.1 Overview of the Application Segmentation Framework
- 4.1.1 Research, Education and Data Collection
- 4.1.2 Industrial and Manufacturing
- 4.1.3 Logistics and Warehousing
- 4.1.4 Service, Healthcare and Entertainment
- 4.2 Comparative Dynamics Across Application Segments
05Regional Market Forecast
- North America
- Europe
- Asia Pacific
- Latin America
- Middle East and Africa
06Country-Level Market Forecast
- 6.1 North America
- 6.1.1 United States
- 6.1.2 Canada
- 6.1.3 Mexico
- 6.1.4 Rest of North America
- 6.2 Europe
- 6.2.1 Germany
- 6.2.2 United Kingdom
- 6.2.3 France
- 6.2.4 Switzerland
- 6.2.5 Netherlands
- 6.2.6 Italy
- 6.2.7 Rest of Europe
- 6.3 Asia Pacific
- 6.3.1 China
- 6.3.2 Japan
- 6.3.3 South Korea
- 6.3.4 Singapore
- 6.3.5 India
- 6.3.6 Australia
- 6.3.7 Rest of Asia Pacific
- 6.4 Latin America
- 6.4.1 Brazil
- 6.4.2 Chile
- 6.4.3 Colombia
- 6.4.4 Argentina
- 6.4.5 Rest of Latin America
- 6.5 Middle East and Africa
- 6.5.1 United Arab Emirates
- 6.5.2 Saudi Arabia
- 6.5.3 Israel
- 6.5.4 South Africa
- 6.5.5 Turkey
- 6.5.6 Rest of Middle East and Africa
07Growth Drivers & Inhibitors
- 7.1 Overview
- 7.2 Market Growth Drivers
- 7.2.1 Surging Venture Capital and Strategic Investment into Tactile Sensing Ecosystems
- 7.2.2 Accelerating Humanoid Robot Deployment and Unit Volume Growth
- 7.2.3 China's National Industrial Policy and Domestic Technology Leadership
- 7.2.4 Growing Demand for Dexterous Manipulation and Embodied AI Training Data
- 7.2.5 Technology Diversification and Cost Reduction Across Sensing Modalities
- 7.2.6 Emerging Healthcare, Service, and Cross-Sector Commercial Applications
- 7.3 Market Inhibitors
- 7.3.1 Predominance of Non-Tactile Deployment Use Cases in the Current Installed Base
- 7.3.2 Rapid Price Erosion and Chinese Competitive Cost Pressure
- 7.3.3 Technology Fragmentation and Absence of Interoperability Standards
- 7.3.4 Durability, Calibration, and Large-Area Deployment Challenges
- 7.3.5 Vertical Integration by Large Humanoid OEMs
- 7.4 Driver and Inhibitor Impact Assessment
- 7.5 Integrated Assessment
08Key Company Profiles
- 8.1 PaXini Tech
- 8.1.1 Company Overview
- 8.1.2 Key Products & Segments
- 8.1.3 Financial Performance (2023–2025)
- 8.1.4 Business Strategy
- 8.1.5 SWOT Analysis
- 8.1.6 Strategic Implications (2025–2031)
- 8.2 Tashan Technology
- 8.2.1 Company Overview
- 8.2.2 Key Products & Segments
- 8.2.3 Financial Performance (2023–2025)
- 8.2.4 Business Strategy
- 8.2.5 SWOT Analysis
- 8.2.6 Strategic Implications (2025–2031)
- 8.3 XELA Robotics
- 8.3.1 Company Overview
- 8.3.2 Key Products & Segments
- 8.3.3 Financial Performance (2023–2025)
- 8.3.4 Business Strategy
- 8.3.5 SWOT Analysis
- 8.3.6 Strategic Implications (2025–2031)
- 8.4 GelSight
- 8.4.1 Company Overview
- 8.4.2 Key Products & Segments
- 8.4.3 Financial Performance (2023–2025)
- 8.4.4 Business Strategy
- 8.4.5 SWOT Analysis
- 8.4.6 Strategic Implications (2025–2031)
- 8.5 Touchlab
- 8.5.1 Company Overview
- 8.5.2 Key Products & Segments
- 8.5.3 Financial Performance (2023–2025)
- 8.5.4 Business Strategy
- 8.5.5 SWOT Analysis
- 8.5.6 Strategic Implications (2025–2031)
- 8.6 Contactile
- 8.6.1 Company Overview
- 8.6.2 Key Products & Segments
- 8.6.3 Financial Performance (2023–2025)
- 8.6.4 Business Strategy
- 8.6.5 SWOT Analysis
- 8.6.6 Strategic Implications (2025–2031)
- 8.7 Daimon Robotics
- 8.7.1 Company Overview
- 8.7.2 Key Products & Segments
- 8.7.3 Financial Performance (2023–2025)
- 8.7.4 Business Strategy
- 8.7.5 SWOT Analysis
- 8.7.6 Strategic Implications (2025–2031)
- 8.8 BeBop Sensors
- 8.8.1 Company Overview
- 8.8.2 Key Products & Segments
- 8.8.3 Financial Performance (2023–2025)
- 8.8.4 Business Strategy
- 8.8.5 SWOT Analysis
- 8.8.6 Strategic Implications (2025–2031)
- 8.9 Tekscan
- 8.9.1 Company Overview
- 8.9.2 Key Products & Segments
- 8.9.3 Financial Performance (2023–2025)
- 8.9.4 Business Strategy
- 8.9.5 SWOT Analysis
- 8.9.6 Strategic Implications (2025–2031)
- 8.10 Interlink Electronics
- 8.10.1 Company Overview
- 8.10.2 Key Products & Segments
- 8.10.3 Financial Performance (2023–2025)
- 8.10.4 Business Strategy
- 8.10.5 SWOT Analysis
- 8.10.6 Strategic Implications (2025–2031)
09Competitive Landscape
- 9.1 Competitive Landscape Overview
- 9.1.1 Market Structure and the Nature of Competition
- 9.1.2 Why Concentration Cannot Be Measured
- 9.1.3 Company Fact Table
- 9.1.4 Competitive Intensity Assessment
- 9.2 Competitive Intensity Assessment
- 9.2.1 Market Structure and Strategic Groupings
- 9.2.2 Capacity Versus Demand Dynamics
- 9.2.3 Pricing Environment and Price Trajectory
- 9.2.4 Barriers to Entry and Exit
- 9.3 Key Player Strategies & Positioning
- 9.3.1 Strategic Group Narrative
- 9.3.2 M&A and Partnership Activity (2022–Present)
- 9.3.3 Geographic Strongholds
- 9.3.4 R&D and Technology Investment Trends
- 9.4 Competitive Dynamics & Strategic Outlook
- 9.4.1 Market Structure
- 9.4.2 Emerging Competitive Threats
- 9.4.3 Consolidation vs. Fragmentation Outlook
- 9.4.4 Competitive Response Matrix
- 9.4.5 Strategic Recommendations for Market Participants, 2025–2031
10Porter's Five Forces Analysis
- 10.1 Threat of New Entrants
- 10.2 Bargaining Power of Buyers
- 10.3 Bargaining Power of Suppliers
- 10.4 Threat of Substitutes
- 10.5 Competitive Rivalry
11PESTLE Analysis
- 11.1 Overview and Analytical Framework
- 11.2 Political
- 11.3 Economic
- 11.4 Social
- 11.5 Technological
- 11.6 Legal
- 11.7 Environmental
- 11.8 PESTLE Summary Table
12SWOT Analysis
- 12.1.1 Detailed Analysis
- 12.2 Strengths
- 12.3 Weaknesses
- 12.4 Opportunities
- 12.5 Threats
- 12.6 Strategic Implications
13Future Trends & Outlook
- 13.1 Trend: Humanoid Robot Volume Ramp Driving Step-Change in E-Skin Demand
- 13.2 Trend: Structural Price Deflation Accelerating Market Penetration
- 13.3 Trend: AI-Integrated Tactile Intelligence Redefining Product Value
- 13.4 Trend: Chinese Domestic Ecosystem Consolidation and Capital Intensity
- 13.5 Trend: Multimodal Vision-Tactile Sensing Gaining Structural Advantage
- 13.6 Trend: Textile and Conformal Skin Surfaces Transitioning from Research to Pre-Commercial
- 13.7 Trend: Application Diversification Beyond Research Into Industrial and Service Verticals
- 13.8 Trend: In-House Tactile Development by Humanoid OEMs Creating Platform Risk
- 13.9 Summary of Key Trends
- 13.10 Forward Outlook: 2026–2031
Tables and figures
- Exhibit 2.1: Forecast of Global Market YoY Growth Rate & CAGR Summary (in %)
- Exhibit 2.2: Forecast of Global Market YoY Growth Rate & CAGR Summary (in %)
- Exhibit 2.3: Forecast of Global (in USD Mn)
- Exhibit 2.4: Forecast of North America (in USD Mn)
- Exhibit 2.5: Forecast of Europe (in USD Mn)
- Exhibit 2.6: Forecast of Asia Pacific (in USD Mn)
- Exhibit 2.7: Forecast of Latin America (in USD Mn)
- Exhibit 2.8: Forecast of Middle East and Africa (in USD Mn)
- Exhibit 2.9: Forecast of Global (in Mn Modules)
- Exhibit 2.10: Forecast of North America (in Mn Modules)
- Exhibit 2.11: Forecast of Europe (in Mn Modules)
- Exhibit 2.12: Forecast of Asia Pacific (in Mn Modules)
- Exhibit 2.13: Forecast of Latin America (in Mn Modules)
- Exhibit 2.14: Forecast of Middle East and Africa (in Mn Modules)
- Exhibit 3.15: Forecast of Piezoresistive (in USD Mn)
- Exhibit 3.16: Forecast of Piezoresistive (in Mn Modules)
- Exhibit 3.17: Forecast of Capacitive (in USD Mn)
- Exhibit 3.18: Forecast of Capacitive (in Mn Modules)
- Exhibit 3.19: Forecast of Optical and Vision-Based (in USD Mn)
- Exhibit 3.20: Forecast of Optical and Vision-Based (in Mn Modules)
- Exhibit 3.21: Forecast of Magnetic and Hall-Effect (in USD Mn)
- Exhibit 3.22: Forecast of Magnetic and Hall-Effect (in Mn Modules)
- Exhibit 3.23: Forecast of Textile, Piezoelectric and Other (in USD Mn)
- Exhibit 3.24: Forecast of Textile, Piezoelectric and Other (in Mn Modules)
- Exhibit 4.25: Forecast of Research, Education and Data Collection (in USD Mn)
- Exhibit 4.26: Forecast of Research, Education and Data Collection (in Mn Modules)
- Exhibit 4.27: Forecast of Industrial and Manufacturing (in USD Mn)
- Exhibit 4.28: Forecast of Industrial and Manufacturing (in Mn Modules)
- Exhibit 4.29: Forecast of Logistics and Warehousing (in USD Mn)
- Exhibit 4.30: Forecast of Logistics and Warehousing (in Mn Modules)
- Exhibit 4.31: Forecast of Service, Healthcare and Entertainment (in USD Mn)
- Exhibit 4.32: Forecast of Service, Healthcare and Entertainment (in Mn Modules)
- Exhibit 6.33: Forecast of North America (in USD Mn)
- Exhibit 6.34: Forecast of United States (in USD Mn)
- Exhibit 6.35: Forecast of Canada (in USD Mn)
- Exhibit 6.36: Forecast of Mexico (in USD Mn)
- Exhibit 6.37: Forecast of Rest of North America (in USD Mn)
- Exhibit 6.38: Forecast of North America (in Mn Modules)
- Exhibit 6.39: Forecast of United States (in Mn Modules)
- Exhibit 6.40: Forecast of Canada (in Mn Modules)
- Exhibit 6.41: Forecast of Mexico (in Mn Modules)
- Exhibit 6.42: Forecast of Rest of North America (in Mn Modules)
- Exhibit 6.43: Forecast of Europe (in USD Mn)
- Exhibit 6.44: Forecast of Germany (in USD Mn)
- Exhibit 6.45: Forecast of United Kingdom (in USD Mn)
- Exhibit 6.46: Forecast of France (in USD Mn)
- Exhibit 6.47: Forecast of Switzerland (in USD Mn)
- Exhibit 6.48: Forecast of Netherlands (in USD Mn)
- Exhibit 6.49: Forecast of Italy (in USD Mn)
- Exhibit 6.50: Forecast of Rest of Europe (in USD Mn)
- Exhibit 6.51: Forecast of Europe (in Mn Modules)
- Exhibit 6.52: Forecast of Germany (in Mn Modules)
- Exhibit 6.53: Forecast of United Kingdom (in Mn Modules)
- Exhibit 6.54: Forecast of France (in Mn Modules)
- Exhibit 6.55: Forecast of Switzerland (in Mn Modules)
- Exhibit 6.56: Forecast of Netherlands (in Mn Modules)
- Exhibit 6.57: Forecast of Rest of Europe (in Mn Modules)
- Exhibit 6.58: Forecast of Asia Pacific (in USD Mn)
- Exhibit 6.59: Forecast of China (in USD Mn)
- Exhibit 6.60: Forecast of Japan (in USD Mn)
- Exhibit 6.61: Forecast of South Korea (in USD Mn)
- Exhibit 6.62: Forecast of Singapore (in USD Mn)
- Exhibit 6.63: Forecast of India (in USD Mn)
- Exhibit 6.64: Forecast of Australia (in USD Mn)
- Exhibit 6.65: Forecast of Rest of Asia Pacific (in USD Mn)
- Exhibit 6.66: Forecast of Asia Pacific (in Mn Modules)
- Exhibit 6.67: Forecast of China (in Mn Modules)
- Exhibit 6.68: Forecast of Japan (in Mn Modules)
- Exhibit 6.69: Forecast of South Korea (in Mn Modules)
- Exhibit 6.70: Forecast of Singapore (in Mn Modules)
- Exhibit 6.71: Forecast of India (in Mn Modules)
- Exhibit 6.72: Forecast of Australia (in Mn Modules)
- Exhibit 6.73: Forecast of Rest of Asia Pacific (in Mn Modules)
- Exhibit 6.74: Forecast of Latin America (in USD Mn)
- Exhibit 6.75: Forecast of Brazil (in USD Mn)
- Exhibit 6.76: Forecast of Chile (in USD Mn)
- Exhibit 6.77: Forecast of Colombia (in USD Mn)
- Exhibit 6.78: Forecast of Argentina (in USD Mn)
- Exhibit 6.79: Forecast of Rest of Latin America (in USD Mn)
- Exhibit 6.80: Forecast of Latin America (in Mn Modules)
- Exhibit 6.81: Forecast of Brazil (in Mn Modules)
- Exhibit 6.82: Forecast of Middle East and Africa (in USD Mn)
- Exhibit 6.83: Forecast of United Arab Emirates (in USD Mn)
- Exhibit 6.84: Forecast of Saudi Arabia (in USD Mn)
- Exhibit 6.85: Forecast of Israel (in USD Mn)
- Exhibit 6.86: Forecast of South Africa (in USD Mn)
- Exhibit 6.87: Forecast of Turkey (in USD Mn)
- Exhibit 6.88: Forecast of Rest of Middle East and Africa (in USD Mn)
- Exhibit 6.89: Forecast of Middle East and Africa (in Mn Modules)
- Exhibit 6.90: Forecast of United Arab Emirates (in Mn Modules)
- Exhibit 6.91: Forecast of Saudi Arabia (in Mn Modules)
- Exhibit 6.92: Forecast of Rest of Middle East and Africa (in Mn Modules)
Frequently asked questions
How large is the global humanoid robot e-skin market?
What is the expected growth rate?
Which region is largest and which grows fastest?
Which sensing technology is largest?
Which application is largest and which grows fastest?
How reliable is the market size?
Does the report include company market shares?
Which companies are profiled?
Does the report include volume?
Research Methodology
All MarketResearchReports.com strategic research reports follow a rigorous, multi-stage methodology combining AI-assisted data synthesis with expert analyst validation.
Systematic collection from 500+ verified sources including SEC filings, industry databases (Bloomberg, Statista, OECD), regulatory filings, trade publications, patent databases, and company annual reports. AI-assisted extraction identifies relevant data points across 10,000+ documents per report.
Dual-validation approach: bottom-up sizing aggregates segment-level production, consumption, and trade data; top-down sizing cross-validates against macroeconomic indicators and total addressable market estimates. Discrepancies >5% trigger analyst review.
Company profiles built from public financial disclosures, product launches, M&A activity, job postings (as capability proxies), and supply chain mapping. Market share estimates triangulated across revenue, capacity, and shipment data.
CAGR projections use time-series regression on 5-10 years of historical data, adjusted for identified demand drivers (technology adoption curves, regulatory catalysts, demographic shifts) and demand inhibitors (cost barriers, substitution risk). Scenario modeling covers base, optimistic, and conservative cases.
All quantitative outputs reviewed by a domain-specialist analyst before publication. Data triangulation requires minimum 3 independent sources for every key figure. Reports undergo a structured peer review against our 47-point quality checklist covering methodology, data citations, logical consistency, and formatting standards.
On-demand reports are generated at time of purchase, incorporating the most recent available data. Static reports are republished when underlying market conditions shift by >10% from baseline assumptions. Purchasers receive update notifications for 12 months.
Related reports
 Navadhi Market Research · Industrial Machinery & Robotics
Global Humanoid Robotics Commercial Deployment Market Strategic Research Report
The global humanoid robotics-industry-strategic-research-report" title="Global Robotics Industry Strategic Research Report">robotics commercial deployment market …
Navadhi Market Research · Industrial Machinery & RoboticsGlobal Construction Equipment Market Strategic Research Report
The global construction equipment market is successfully transitioning from a highly volatile, cyclical recovery phase into a structurally resilient, long-term infra…
Navadhi Market Research · Industrial Machinery & RoboticsGlobal Robot Hands / Dexterous Grippers Market Strategic Research Report
The Global Robot Hands & Dexterous Grippers market represents one of the fastest-evolving intersections of industrial automation, artificial intelligence, and hu…
Need a customized version?
Get country-, segment- or company-specific intelligence tailored to your exact requirements.
Request custom research →Request a sample report
Receive a sample of Global Humanoid Robot E-Skin Market Strategic Research Report before you buy. Please note that the sample report contains full table of contents, extracts of selected chapters and the list of exhibits. Charts and detailed figures are reserved for the full report; the sample shows only the headline numbers already published on this page.
Customize This Report
Describe your specific requirements and our analysts will scope and deliver a tailored version.
Request Invoice
We will email a proforma invoice within 24 hours. Report access is granted upon payment confirmation.
Leading Brands in This Industry