Global Travel & Tourism Industry Strategic Research Report
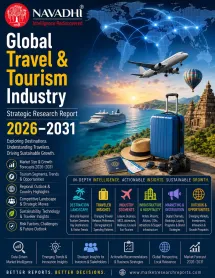
By Type: Leisure Travel, Business Travel, Domestic and Other Travel
By Application: Online Travel Agencies (OTA), Direct Booking (Hotel/Airline/Cruise), Traditional Travel Agents
Regional Forecast: Asia Pacific, Latin America, MEA, Europe, North America
Key Players: Booking Holdings, Marriott International, Carnival Corporation, Expedia Group, Royal Caribbean Group, Airbnb Inc., Hilton Worldwide Holdings, Trip.com Group, Delta Air Lines, American Airlines Group, International Airlines Group (IAG), Deutsche Lufthansa AG, TUI Group, Accor SA, InterContinental Hotels Group (IHG), Southwest Airlines, Ryanair Holdings, easyJet plc, Norwegian Cruise Line Holdings, Wyndham Hotels &, Resorts, Choice Hotels International, Tripadvisor Inc., MakeMyTrip Limited, American Express Global Business Travel, Sabre Corporation
Overview
The global travel, tourism, and hospitality-industry-strategic-research-report" title="Global Hospitality Industry Strategic Research Report">hospitality industry reached an estimated $10.0 trillion in total economic contribution in 2025, representing one of the largest and most structurally complex consumer-facing sectors in the global economy. This headline valuation represents a consensus midpoint derived from three independently published, methodologically aligned estimates: dataintelo.com ($9.5 trillion), CustomMarketInsights ($9.897 trillion), and ResearchNester ($10.62 trillion), all published with a 2025 reference year and all employing the WTTC-aligned total economic contribution framework -- encompassing direct, indirect, and induced effects across the full value chain, materially distinct from narrower direct-revenue-only estimates, which independent sources typically place in the $1.0-1.1 trillion range for 2025. The industry is forecast to reach approximately $13.79 trillion by 2031, a compound annual growth rate of approximately 5.5%, a calibrated midpoint across the 4.1%-7.2% range published across primary source estimates.
Partnership and consolidation activity since 2022 has concentrated at the intersection of distribution and loyalty. Booking Holdings deepened its strategic investment in Meituan (China) and has sustained its equity stake in Grab (Southeast Asia) as a mechanism for OTA distribution penetration into markets where its own brand awareness trails Trip.com. Expedia completed the integration of Vrbo more substantively into its One Key framework in 2023, a move explicitly targeting Airbnb's alternative-accommodation market share. TUI Group completed its delisting from the London Stock Exchange in 2024, consolidating its primary listing in Frankfurt. IAG moved to acquire Air Europa in a transaction that faced prolonged European Commission scrutiny before receiving conditional approval in 2024, extending its Madrid hub dominance. In the hotel sector, Hilton's 2023 acquisition of Graduate Hotels expanded its lifestyle-boutique footprint, and its 2024 licensing agreement with Small Luxury Hotels of the World added approximately 580 independent properties to its loyalty redemption network without incremental balance-sheet commitment.
Scope of Global Travel, Tourism & Hospitality Industry Strategic Research Report 2026-2031
- This report provides forecast data by value for the global travel, tourism, and hospitality industry, with 2025 as the base year and forecasting to 2031.
- This report provides segmentation by travel type (Leisure Travel, Business Travel, Domestic and Other Travel) and by booking/distribution channel (Online Travel Agencies (OTA), Direct Booking (Hotel/Airline/Cruise), Traditional Travel Agents).
- This report provides region-wise and country-level forecast data across 5 regions and 17 countries.
- This report identifies key growth drivers and inhibitors, including rising middle-class travel demand, low-cost carrier expansion, and AI-driven booking personalization.
- This report provides company profiles for the 25 leading travel, tourism, and hospitality companies, each covering Company Overview, Key Products & Segments, Financial Performance, Business Strategy, SWOT Analysis, and Strategic Implications.
- This report provides Porter's Five Forces, PESTLE, and SWOT analysis.
- This report identifies key future trends through 2031.
Segment by Type
- Leisure Travel
- Business Travel
- Domestic and Other Travel
Segment by Application
- Online Travel Agencies (OTA)
- Direct Booking (Hotel/Airline/Cruise)
- Traditional Travel Agents
Segment by Region
- Asia-Pacific (China, Japan, India, South Korea, Thailand, Rest of Asia Pacific)
- Europe (Spain, France, Germany, United Kingdom, Italy, Rest of Europe)
- North America (United States, Canada, Rest of North America)
- Latin America (Mexico, Brazil, Rest of Latin America)
- Middle East & Africa (Saudi Arabia, UAE, South Africa, Rest of Middle East and Africa)
Who Can Use the Global Travel, Tourism & Hospitality Industry Strategic Research Report?
This research report is ideal for people who wish to gain a thorough understanding of the travel and tourism market. Some of the intended users are:
- C-level executives and Company Directors at airlines, hotels, cruise lines, and online travel agencies
- Investment managers, Financial professionals, and Travel/Hospitality sector equity analysts
- Corporate travel management and procurement professionals benchmarking supplier landscapes
- M&A advisors assessing consolidation dynamics across the travel value chain
- Anyone operating in the global travel, tourism, and hospitality value chain
Market snapshot
Global Travel & Tourism Industry Strategic Research Report snapshot, 2025–2031
 © MarketResearchReports.comDisclaimer: The actual data may vary in the final report which undergoes verification check post order confirmation.
Segments covered in this report
Table of contents
01Executive Summary
- 1.1 Global Travel & Tourism Industry Strategic Research Report 2026–2031
- 1.2 Market Valuation & Growth Trajectory
- 1.3 Scope, Methodology & Value-Chain Coverage
- 1.4 Segment Dynamics: Travel Type
- 1.5 Segment Dynamics: Booking & Distribution Channels
- 1.6 Regional Landscape
- 1.7 Competitive Landscape: 25-Company Profile Coverage
- 1.8 Report Positioning & Pricing
02Industry Overview & Forecast
- 2.1 Market Size and Baseline Assessment
- 2.2 Historical Trajectory and Recovery Context
- 2.3 Forecast: 2026–2031
- 2.4 Segment by Travel Type
- 2.5 Segment by Booking and Distribution Channel
- 2.6 Regional Dimension
- 2.7 Growth Rate Convergence and Structural Implications
03Market Segmentation by Type
- 3.1 Overview and Segment Architecture
- 3.2 Leisure Travel
- 3.2.1 Segment Scale and Historical Trajectory
- 3.2.2 Forecast Trajectory to 2031
- 3.2.3 Structural Demand Drivers
- 3.3 Business Travel
- 3.3.1 Segment Scale and Recovery Profile
- 3.3.2 Forecast Trajectory to 2031
- 3.3.3 Structural Demand Drivers and Constraints
- 3.4 Domestic and Other Travel
- 3.4.1 Segment Scale and Distinct Growth Profile
- 3.4.2 Forecast Trajectory to 2031
- 3.5 Cross-Segment Analysis and Strategic Implications
- 3.5.1 Segment Share Dynamics
- 3.5.2 Investment and Strategic Relevance
04Market Segmentation by Application
- 4.1 Section Overview
- 4.2 Channel Segment Landscape: 2025 Baseline
- 4.3 Online Travel Agencies
- 4.3.1 Scale, Growth, and Structural Momentum
- 4.3.2 Competitive Architecture of the OTA Segment
- 4.3.3 Technology Drivers Reshaping OTA Competitive Dynamics
- 4.3.4 Regulatory Headwinds for the OTA Segment
- 4.4 Direct Booking
- 4.4.1 Scale, Growth, and the Loyalty-Led Defensive Strategy
- 4.4.2 The Loyalty Programme as the Primary Direct Channel Defence
- 4.4.3 Asset-Light Hotel Models and Direct Booking Channel Management
- 4.4.4 Airlines and the Low-Cost Carrier Direct Booking Advantage
- 4.5 Traditional Travel Agents
- 4.5.1 Scale, Resilience, and Structural Repositioning
- 4.5.2 The Luxury and Complex Itinerary Premium
- 4.5.3 Group and Corporate Segments Supporting Volume
- 4.5.4 Technological Adaptation and Hybrid Models
- 4.6 Other Channels
- 4.6.1 Segment Composition and Scale
- 4.6.2 Tour Operators and Integrated Travel Groups
- 4.6.3 Corporate Travel Management Companies
- 4.6.4 Global Distribution Systems as Infrastructure Layer
- 4.7 Cross-Channel Competitive Dynamics and Strategic Themes
- 4.7.1 The Commission War and Margin Compression
- 4.7.2 Artificial Intelligence and the Future of Channel Architecture
- 4.7.3 Sustainability Preferences and Channel Selection
- 4.8 Forward-Looking Market Outlook by Channel, 2026–2031
05Regional Market Forecast
- North America
- Europe
- Asia-Pacific
- Latin America
- Middle East & Africa
06Country-Level Market Forecast
- 6.1 Asia-Pacific
- 6.1.1 China
- 6.1.2 Japan
- 6.1.3 India
- 6.1.4 South Korea
- 6.1.5 Thailand
- 6.1.6 Rest of Asia Pacific
- 6.2 Europe
- 6.2.1 Spain
- 6.2.2 France
- 6.2.3 Germany
- 6.2.4 United Kingdom
- 6.2.5 Italy
- 6.2.6 Rest of Europe
- 6.3 North America
- 6.3.1 United States
- 6.3.2 Canada
- 6.3.3 Rest of North America
- 6.4 Latin America
- 6.4.1 Mexico
- 6.4.2 Brazil
- 6.4.3 Rest of Latin America
- 6.5 Middle East & Africa
- 6.5.1 Saudi Arabia
- 6.5.2 UAE
- 6.5.3 South Africa
- 6.5.4 Rest of Middle East and Africa
07Growth Drivers & Inhibitors
- 7.1 Overview
- 7.2 Growth Drivers
- 7.2.1 Rising Affluence and the Expanding Global Middle Class
- 7.2.2 The Structural Shift to Experiential Consumption
- 7.2.3 Digitalization, OTA Growth, and the Online Booking Revolution
- 7.2.4 Business Travel Recovery and Managed Travel Evolution
- 7.2.5 Infrastructure Investment and Government Tourism Policy
- 7.2.6 Alternative Accommodation and the Platform Economy
- 7.3 Growth Inhibitors
- 7.3.1 Macroeconomic Sensitivity and Consumer Confidence Volatility
- 7.3.2 Geopolitical Risk and Regional Conflict Exposure
- 7.3.3 Overtourism, Resident Pushback, and Carrying Capacity Constraints
- 7.3.4 Sustainability Pressures and Carbon Regulation Risk
- 7.3.5 Capacity Constraints in Aviation Infrastructure
- 7.3.6 Labor Market Tightness and Cost Inflation
- 7.4 Balancing the Equation: Net Growth Outlook
08Key Company Profiles (Booking Holdings, Marriott International, Carnival Corporation, Expedia Group, Royal Caribbean Group, Airbnb Inc., Hilton Worldwide Holdings, Trip.com Group, Delta Air Lines, American Airlines Group, International Airlines Group (IAG), Deutsche Lufthansa AG, TUI Group, Accor SA, InterContinental Hotels Group (IHG), Southwest Airlines, Ryanair Holdings, easyJet plc, Norwegian Cruise Line Holdings, Wyndham Hotels & Resorts, Choice Hotels International, Tripadvisor Inc., MakeMyTrip Limited, American Express Global Business Travel, Sabre Corporation)
- 8.1 Booking Holdings
- 8.1.1 Company Overview
- 8.1.2 Key Products & Segments
- 8.1.3 Financial Performance (2023–2025)
- 8.1.4 Business Strategy
- 8.1.5 SWOT Analysis
- 8.1.6 Strategic Implications (2025–2031)
- 8.2 Marriott International
- 8.2.1 Company Overview
- 8.2.2 Key Products & Segments
- 8.2.3 Financial Performance (2023–2025)
- 8.2.4 Business Strategy
- 8.2.5 SWOT Analysis
- 8.2.6 Strategic Implications (2025–2031)
- 8.3 Carnival Corporation
- 8.3.1 Company Overview
- 8.3.2 Key Products & Segments
- 8.3.3 Financial Performance (2023–2025)
- 8.3.4 Business Strategy
- 8.3.5 SWOT Analysis
- 8.3.6 Strategic Implications (2025–2031)
- 8.4 Expedia Group
- 8.4.1 Company Overview
- 8.4.2 Key Products & Segments
- 8.4.3 Financial Performance (2023–2025)
- 8.4.4 Business Strategy
- 8.4.5 SWOT Analysis
- 8.4.6 Strategic Implications (2025–2031)
- 8.5 Royal Caribbean Group
- 8.5.1 Company Overview
- 8.5.2 Key Products & Segments
- 8.5.3 Financial Performance (2023–2025)
- 8.5.4 Business Strategy
- 8.5.5 SWOT Analysis
- 8.5.6 Strategic Implications (2025–2031)
- 8.6 Airbnb Inc.
- 8.6.1 Company Overview
- 8.6.2 Key Products & Segments
- 8.6.3 Financial Performance (2023–2025)
- 8.6.4 Business Strategy
- 8.6.5 SWOT Analysis
- 8.6.6 Strategic Implications (2025–2031)
- 8.7 Hilton Worldwide Holdings
- 8.7.1 Company Overview
- 8.7.2 Key Products & Segments
- 8.7.3 Financial Performance (2023–2025)
- 8.7.4 Business Strategy
- 8.7.5 SWOT Analysis
- 8.7.6 Strategic Implications (2025–2031)
- 8.8 Trip.com Group
- 8.8.1 Company Overview
- 8.8.2 Key Products & Segments
- 8.8.3 Financial Performance (2023–2025)
- 8.8.4 Business Strategy
- 8.8.5 SWOT Analysis
- 8.8.6 Strategic Implications (2025–2031)
- 8.9 Delta Air Lines
- 8.9.1 Company Overview
- 8.9.2 Key Products & Segments
- 8.9.3 Financial Performance (2023–2025)
- 8.9.4 Business Strategy
- 8.9.5 SWOT Analysis
- 8.9.6 Strategic Implications (2025–2031)
- 8.10 American Airlines Group
- 8.10.1 Company Overview
- 8.10.2 Key Products & Segments
- 8.10.3 Financial Performance (2023–2025)
- 8.10.4 Business Strategy
- 8.10.5 SWOT Analysis
- 8.10.6 Strategic Implications (2025–2031)
- 8.11 International Airlines Group (IAG)
- 8.11.1 Company Overview
- 8.11.2 Key Products & Segments
- 8.11.3 Financial Performance (2023–2025)
- 8.11.4 Business Strategy
- 8.11.5 SWOT Analysis
- 8.11.6 Strategic Implications (2025–2031)
- 8.12 Deutsche Lufthansa AG
- 8.12.1 Company Overview
- 8.12.2 Key Products & Segments
- 8.12.3 Financial Performance (2023–2025)
- 8.12.4 Business Strategy
- 8.12.5 SWOT Analysis
- 8.12.6 Strategic Implications (2025–2031)
- 8.13 TUI Group
- 8.13.1 Company Overview
- 8.13.2 Key Products & Segments
- 8.13.3 Financial Performance (2023–2025)
- 8.13.4 Business Strategy
- 8.13.5 SWOT Analysis
- 8.13.6 Strategic Implications (2025–2031)
- 8.14 Accor SA
- 8.14.1 Company Overview
- 8.14.2 Key Products & Segments
- 8.14.3 Financial Performance (2023–2025)
- 8.14.4 Business Strategy
- 8.14.5 SWOT Analysis
- 8.14.6 Strategic Implications (2025–2031)
- 8.15 InterContinental Hotels Group (IHG)
- 8.15.1 Company Overview
- 8.15.2 Key Products & Segments
- 8.15.3 Financial Performance (2023–2025)
- 8.15.4 Business Strategy
- 8.15.5 SWOT Analysis
- 8.15.6 Strategic Implications (2025–2031)
- 8.16 Southwest Airlines
- 8.16.1 Company Overview
- 8.16.2 Key Products & Segments
- 8.16.3 Financial Performance (2023–2025)
- 8.16.4 Business Strategy
- 8.16.5 SWOT Analysis
- 8.16.6 Strategic Implications (2025–2031)
- 8.17 Ryanair Holdings
- 8.17.1 Company Overview
- 8.17.2 Key Products & Segments
- 8.17.3 Financial Performance (2023–2025)
- 8.17.4 Business Strategy
- 8.17.5 SWOT Analysis
- 8.17.6 Strategic Implications (2025–2031)
- 8.18 easyJet plc
- 8.18.1 Company Overview
- 8.18.2 Key Products & Segments
- 8.18.3 Financial Performance (2023–2025)
- 8.18.4 Business Strategy
- 8.18.5 SWOT Analysis
- 8.18.6 Strategic Implications (2025–2031)
- 8.19 Norwegian Cruise Line Holdings
- 8.19.1 Company Overview
- 8.19.2 Key Products & Segments
- 8.19.3 Financial Performance (2023–2025)
- 8.19.4 Business Strategy
- 8.19.5 SWOT Analysis
- 8.19.6 Strategic Implications (2025–2031)
- 8.20 Wyndham Hotels & Resorts
- 8.20.1 Company Overview
- 8.20.2 Key Products & Segments
- 8.20.3 Financial Performance (2023–2025)
- 8.20.4 Business Strategy
- 8.20.5 SWOT Analysis
- 8.20.6 Strategic Implications (2025–2031)
- 8.21 Choice Hotels International
- 8.21.1 Company Overview
- 8.21.2 Key Products & Segments
- 8.21.3 Financial Performance (2023–2025)
- 8.21.4 Business Strategy
- 8.21.5 SWOT Analysis
- 8.21.6 Strategic Implications (2025–2031)
- 8.22 Tripadvisor Inc.
- 8.22.1 Company Overview
- 8.22.2 Key Products & Segments
- 8.22.3 Financial Performance (2023–2025)
- 8.22.4 Business Strategy
- 8.22.5 SWOT Analysis
- 8.22.6 Strategic Implications (2025–2031)
- 8.23 MakeMyTrip Limited
- 8.23.1 Company Overview
- 8.23.2 Key Products & Segments
- 8.23.3 Financial Performance (2023–2025)
- 8.23.4 Business Strategy
- 8.23.5 SWOT Analysis
- 8.23.6 Strategic Implications (2025–2031)
- 8.24 American Express Global Business Travel
- 8.24.1 Company Overview
- 8.24.2 Key Products & Segments
- 8.24.3 Financial Performance (2023–2025)
- 8.24.4 Business Strategy
- 8.24.5 SWOT Analysis
- 8.24.6 Strategic Implications (2025–2031)
- 8.25 Sabre Corporation
- 8.25.1 Company Overview
- 8.25.2 Key Products & Segments
- 8.25.3 Financial Performance (2023–2025)
- 8.25.4 Business Strategy
- 8.25.5 SWOT Analysis
- 8.25.6 Strategic Implications (2025–2031)
09Competitive Landscape
- 9.1 Competitive Landscape Overview
- 9.1.1 Market Structure by Value-Chain Layer
- 9.1.2 Concentration Analysis
- 9.1.3 Overall Competitive Intensity
- 9.2 Competitive Intensity Assessment
- 9.2.1 Tier Classification by Revenue Scale
- 9.2.2 Capacity vs. Demand Dynamics by Layer
- 9.2.3 Pricing Environment
- 9.2.4 Barriers to Entry and Exit
- 9.3 Key Player Strategies & Positioning
- 9.3.1 Strategic Group Mapping
- 9.3.2 Differentiation Strategies by Strategic Group
- 9.3.3 Selected Key Player Financial & Strategic Summary (FY2025)
- 9.3.4 M&A and Partnership Activity (2022–Present)
- 9.3.5 R&D and Technology Investment
- 9.4 Competitive Dynamics & Strategic Outlook
- 9.4.1 Emerging Competitive Threats
- 9.4.2 Consolidation vs. Fragmentation Outlook
- 9.4.3 Competitive Response Matrix
- 9.4.4 Strategic Recommendations for 2025–2031
10Porter's Five Forces Analysis
- 10.1 Threat of New Entrants
- 10.1.1 Key Factors
- 10.1.2 Market-Specific Context
- 10.1.3 Trend
- 10.1.4 Strategic Implication
- 10.2 Bargaining Power of Buyers
- 10.3 Bargaining Power of Suppliers
- 10.3.1 Key Factors
- 10.3.2 Market-Specific Context
- 10.3.3 Trend: Strengthening
- 10.3.4 Strategic Implication
- 10.4 Threat of Substitutes
- 10.4.1 Key Factors
- 10.4.2 Market-Specific Context
- 10.4.3 Trend: Strengthening — Selectively and Non-Uniformly
- 10.4.4 Strategic Implication
- 10.5 Competitive Rivalry
11PESTLE Analysis
- 11.1 Overview
- 11.2 Political
- 11.3 Economic
- 11.4 Sociocultural
- 11.5 Technological
- 11.6 Legal
- 11.7 Environmental
12SWOT Analysis
- 12.1 Overview
- 12.2 Strengths
- 12.2.1 Scale and Economic Indispensability
- 12.2.2 Dominant Leisure Travel Engine
- 12.2.3 Concentrated Corporate Leadership and Balance-Sheet Depth
- 12.2.4 Digital Distribution Infrastructure and OTA Dominance
- 12.2.5 Asia-Pacific as a Structural Growth Engine
- 12.3 Weaknesses
- 12.3.1 Structural Vulnerability to Exogenous Shocks
- 12.3.2 Labour Market Pressures and Skills Shortages
- 12.3.3 Dependence on Concentrated Demand Origins
- 12.3.4 Environmental and Social Licence Pressures
- 12.3.5 Fragmented Quality and Regulatory Environments Across Geographies
- 12.4 Opportunities
- 12.4.1 Asia-Pacific Middle-Class Expansion and Outbound Growth
- 12.4.2 Sustainable and Responsible Tourism as a Premium Growth Segment
- 12.4.3 Technology-Driven Personalisation and Ancillary Revenue Expansion
- 12.4.4 OTA and Digital Platform Growth in Underpenetrated Markets
- 12.4.5 Middle East Tourism Infrastructure Investment and Destination Development
- 12.4.6 Cruise Line Capacity Expansion and Demographic Broadening
- 12.5 Threats
- 12.5.1 Macroeconomic Volatility and Consumer Spending Compression
- 12.5.2 Geopolitical Disruption and Destination Insecurity
- 12.5.3 Climate Change and Environmental Regulatory Escalation
- 12.5.4 Platform and Technology Disruption to Traditional Business Models
- 12.5.5 Rising Environmental and Overtourism Regulation at Destination Level
- 12.5.6 Cybersecurity Vulnerabilities and Data Privacy Exposure
- 12.6 Strategic Synthesis
13Future Trends & Outlook
- 13.1 Overview of the Forward Trajectory
- 13.2 Digitalisation and Platform Consolidation
- 13.3 Artificial Intelligence and Predictive Personalisation
- 13.4 Sustainability as a Strategic and Regulatory Imperative
- 13.5 Experiential and Wellness Travel
- 13.6 Regional Growth Corridors
- 13.7 Business Travel Recovery and Evolution
- 13.8 Risk Factors and Forecast Sensitivity
- 13.9 Strategic Implications for Industry Participants
Tables and figures
- 2.1 Exhibit 2.1: Forecast of Global Market YoY Growth Rate & CAGR Summary (in %)
- 2.2 Exhibit 2.2: Forecast of Global (in USD Bn)
- 2.3 Exhibit 2.3: Forecast of Asia-Pacific (in USD Bn)
- 2.4 Exhibit 2.4: Forecast of Europe (in USD Bn)
- 2.5 Exhibit 2.5: Forecast of North America (in USD Bn)
- 2.6 Exhibit 2.6: Forecast of Latin America (in USD Bn)
- 2.7 Exhibit 2.7: Forecast of Middle East & Africa (in USD Bn)
- 3.8 Exhibit 3.8: Forecast of Leisure Travel (in USD Bn)
- 3.9 Exhibit 3.9: Forecast of Business Travel (in USD Bn)
- 3.10 Exhibit 3.10: Forecast of Domestic & Other Travel (residual) (in USD Bn)
- 4.11 Exhibit 4.11: Forecast of Online Travel Agencies (OTA) (in USD Bn)
- 4.12 Exhibit 4.12: Forecast of Direct Booking (Hotel/Airline/Cruise) (in USD Bn)
- 4.13 Exhibit 4.13: Forecast of Traditional Travel Agents (in USD Bn)
- 4.14 Exhibit 4.14: Forecast of Segment Application (in USD Bn)
- 6.15 Exhibit 6.15: Forecast of Asia-Pacific (in USD Bn)
- 6.16 Exhibit 6.16: Forecast of China (in USD Bn)
- 6.17 Exhibit 6.17: Forecast of Japan (in USD Bn)
- 6.18 Exhibit 6.18: Forecast of India (in USD Bn)
- 6.19 Exhibit 6.19: Forecast of South Korea (in USD Bn)
- 6.20 Exhibit 6.20: Forecast of Thailand (in USD Bn)
- 6.21 Exhibit 6.21: Forecast of Rest of Asia Pacific (in USD Bn)
- 6.22 Exhibit 6.22: Forecast of Europe (in USD Bn)
- 6.23 Exhibit 6.23: Forecast of Spain (in USD Bn)
- 6.24 Exhibit 6.24: Forecast of France (in USD Bn)
- 6.25 Exhibit 6.25: Forecast of Germany (in USD Bn)
- 6.26 Exhibit 6.26: Forecast of United Kingdom (in USD Bn)
- 6.27 Exhibit 6.27: Forecast of Italy (in USD Bn)
- 6.28 Exhibit 6.28: Forecast of Rest of Europe (in USD Bn)
- 6.29 Exhibit 6.29: Forecast of North America (in USD Bn)
- 6.30 Exhibit 6.30: Forecast of United States (in USD Bn)
- 6.31 Exhibit 6.31: Forecast of Canada (in USD Bn)
- 6.32 Exhibit 6.32: Forecast of Rest of North America (in USD Bn)
- 6.33 Exhibit 6.33: Forecast of Latin America (in USD Bn)
- 6.34 Exhibit 6.34: Forecast of Mexico (in USD Bn)
- 6.35 Exhibit 6.35: Forecast of Brazil (in USD Bn)
- 6.36 Exhibit 6.36: Forecast of Rest of Latin America (in USD Bn)
- 6.37 Exhibit 6.37: Forecast of Middle East & Africa (in USD Bn)
- 6.38 Exhibit 6.38: Forecast of Saudi Arabia (in USD Bn)
- 6.39 Exhibit 6.39: Forecast of UAE (in USD Bn)
- 6.40 Exhibit 6.40: Forecast of South Africa (in USD Bn)
- 6.41 Exhibit 6.41: Forecast of Rest of Middle East and Africa (in USD Bn)
Frequently asked questions
What is the current size of the global travel, tourism, and hospitality industry?
Why does this report use a $10.0 trillion figure when some sources cite closer to $1 trillion?
What is the industry forecast to reach by 2031?
Which travel segment is the largest?
Which distribution channel is growing fastest?
Which region leads the global travel and tourism market?
Who are the key companies covered in this report?
What is driving M&A activity in the travel and tourism industry?
What forecast period does this report cover?
How reliable is the travel and tourism forecast?
Is the cruise industry growing faster than airlines or hotels?
What role does TUI Group play in the industry?
Research Methodology
All MarketResearchReports.com strategic research reports follow a rigorous, multi-stage methodology combining AI-assisted data synthesis with expert analyst validation.
Systematic collection from 500+ verified sources including SEC filings, industry databases (Bloomberg, Statista, OECD), regulatory filings, trade publications, patent databases, and company annual reports. AI-assisted extraction identifies relevant data points across 10,000+ documents per report.
Dual-validation approach: bottom-up sizing aggregates segment-level production, consumption, and trade data; top-down sizing cross-validates against macroeconomic indicators and total addressable market estimates. Discrepancies >5% trigger analyst review.
Company profiles built from public financial disclosures, product launches, M&A activity, job postings (as capability proxies), and supply chain mapping. Market share estimates triangulated across revenue, capacity, and shipment data.
CAGR projections use time-series regression on 5-10 years of historical data, adjusted for identified demand drivers (technology adoption curves, regulatory catalysts, demographic shifts) and demand inhibitors (cost barriers, substitution risk). Scenario modeling covers base, optimistic, and conservative cases.
All quantitative outputs reviewed by a domain-specialist analyst before publication. Data triangulation requires minimum 3 independent sources for every key figure. Reports undergo a structured peer review against our 47-point quality checklist covering methodology, data citations, logical consistency, and formatting standards.
On-demand reports are generated at time of purchase, incorporating the most recent available data. Static reports are republished when underlying market conditions shift by >10% from baseline assumptions. Purchasers receive update notifications for 12 months.
Related reports
 Navadhi Market Research · Travel, Tourism & Hospitality
Global Next-Generation Dynamic Pricing Engines and Machine Learning in Airline Revenue Management Systems Market Strategic Research Report
The global market for next-generation dynamic pricing engines and machine learning in airline revenue management systems represents one of the most commercially cons…
Navadhi Market Research · Travel, Tourism & HospitalityGlobal eVTOL Urban Air Mobility and Tourism Shuttle Infrastructure Market Strategic Research Report
The global electric vertical takeoff and landing (eVTOL) urban air mobility and tourism shuttle infrastructure Market Strategic Research Report">global electric v…
Navadhi Market Research · Travel, Tourism & HospitalityGlobal Experiential and Fandom Tourism Infrastructure Market Strategic Research Report
The global experiential and fandom tourism infrastructure market sits at the intersection of entertainment IP, live event production, and destination development, en…
Need a customized version?
Get country-, segment- or company-specific intelligence tailored to your exact requirements.
Request custom research →Request a sample report
Receive a sample of Global Travel & Tourism Industry Strategic Research Report before you buy. Please note that the sample report contains full table of contents, extracts of selected chapters and the list of exhibits. Charts and detailed figures are reserved for the full report; the sample shows only the headline numbers already published on this page.
Customize This Report
Describe your specific requirements and our analysts will scope and deliver a tailored version.
Request Invoice
We will email a proforma invoice within 24 hours. Report access is granted upon payment confirmation.
Leading Brands in This Industry