


While Everyone Watches Nvidia, Three Structural Shifts Are Quietly Reshaping Who Wins in Semiconductors
MRR® Industry Intelligence Briefing Semiconductor · Electronics · Market Analysis
Most semiconductor coverage right now runs on a single storyline: Nvidia is winning, AI demand is infinite, and everyone else is a supporting character. That storyline is directionally true and almost entirely unhelpful for anyone actually trying to assess competitive position in this industry, because it skips past three structural shifts that will matter more to who wins the next five years than this quarter's GPU shipment numbers.
Executive Summary
The global semiconductor industry reached $791.7 billion in confirmed 2025 sales, up 25.6% year-over-year, and is forecast to reach $3,011.1 billion by 2031, a 24.9% compound annual growth rate, according to Navadhi Market Research's Global Semiconductor Industry Strategic Research Report. WSTS's own official Spring 2026 forecast projects a further 89.9% surge in 2026 alone, driven overwhelmingly by AI accelerator and High-Bandwidth Memory demand. Twenty-five companies are profiled in depth, and the more useful story for anyone allocating capital or assessing supply risk right now isn't that AI demand is strong - everyone already knows that. It's which of three specific structural shifts a given company is actually exposed to, because those three are reshaping the competitive map faster than headline GPU demand numbers suggest.
The Research Problem: "AI Demand Is Strong" Isn't a Competitive Thesis
Nvidia's numbers earned their coverage honestly - the company became the first semiconductor business in history to cross $100 billion in annual revenue in 2025, contributing more than 35% of the entire industry's incremental growth for the year. A narrative built entirely around continued GPU dominance isn't wrong about the present. It's incomplete about where the next competitive battles are actually forming.
The shift most underweighted in generalist coverage is geographic. North America's share of global semiconductor sales is projected to rise from 33.0% in 2025 to 41.1% by 2031 - not because Asia-Pacific's own industry is shrinking, but because CHIPS Act-funded domestic fab capacity is only now beginning to come online at scale. As of mid-2026, just three CHIPS-funded logic fabs had reached volume production. TSMC's second Arizona fab alone reaches volume production in Q1 2027, a full year ahead of its original schedule.
The second underweighted story is memory, specifically the supply-demand imbalance in High-Bandwidth Memory that's quietly making SK Hynix one of the best-performing large-cap stories in the entire sector, with far less coverage than Nvidia's headline numbers attract. A competitive assessment that treats "AI is driving growth" as a single undifferentiated tailwind, rather than tracking exactly which companies are structurally exposed to reshoring, HBM supply constraints, or neither, will misjudge where the next several years of margin expansion and share gains actually concentrate.
Three Structural Shifts, Three Different Competitive Games
Shift One - The Reshoring of Manufacturing Share
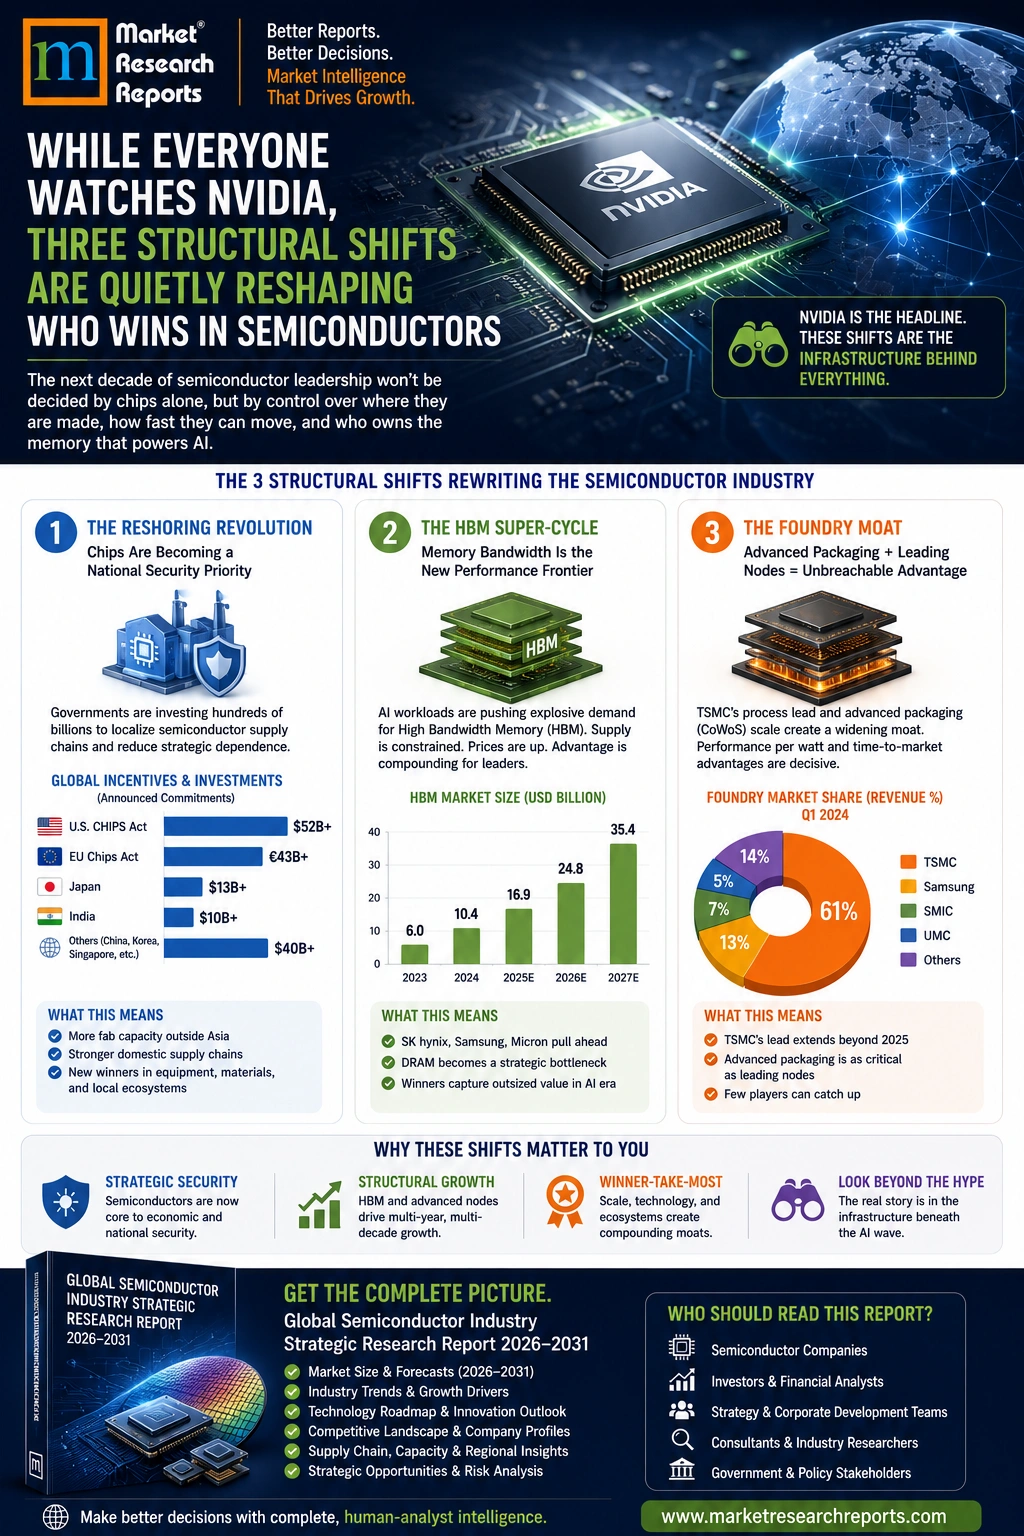
WSTS's own regional growth data confirms this is structural, not noise: Americas semiconductor sales grew 112% in 2026 per WSTS's official forecast, against 87% for Asia-Pacific - a widening gap visible in SIA's own monthly releases throughout the year (Americas year-over-year growth accelerated from 59.2% in February to 160.9% by June, consistently outpacing Asia-Pacific's own strong but comparatively slower acceleration). This is the CHIPS Act's capacity finally showing up in the numbers, years after the legislation itself, and most competitive coverage still treats semiconductor manufacturing as a fixture of Asian industrial geography rather than a share that's actively shifting under a $165 billion TSMC investment and Intel's own Ohio expansion.
Shift Two - The Memory Supply Squeeze Nobody's Pricing In
SK Hynix posted 37% revenue growth in 2025, attributable almost entirely to its position as the leading global HBM supplier - a company generating Nvidia-adjacent growth rates with a fraction of Nvidia's media coverage. Current HBM demand substantially exceeds production capacity across all three major suppliers (SK Hynix, Samsung, Micron), creating a supply-constrained pricing environment structurally different from the demand-constrained dynamics most of the rest of the industry operates under. This is the mechanism behind WSTS's extraordinary 2026 Memory forecast - revenue projected to surge roughly 250% year-over-year, nearly quadrupling in a single year.
Shift Three - TSMC's Dominance Is Widening, Not Peaking
TSMC's share of global foundry revenue rose from 62.8% in Q1 2024 to 72.2% in Q4 2025, according to TrendForce - an unusual trajectory for a company already this large, and one that stands in direct contrast to the market's preoccupation with Intel's more headline-grabbing struggles (the U.S. government took a 10% equity stake in Intel in August 2025, even as the company's market share continued its multi-year decline to roughly 6%, half its 2021 level). The foundry story isn't "Intel versus TSMC." It's TSMC pulling further ahead of everyone, Intel included, while policy attention focuses elsewhere.
Where the Top Companies Sit Across the Three Shifts
| Company | Primary Shift Exposure | What to Watch |
|---|---|---|
| Nvidia | AI/Logic demand (indirect reshoring beneficiary via TSMC Arizona) | Custom ASIC competition eroding GPU-only positioning |
| TSMC | Reshoring (direct) + foundry dominance | Arizona fab ramp pace vs. Taiwan capacity balance |
| SK Hynix | HBM supply squeeze | Capacity expansion timeline vs. sustained pricing power |
| Samsung Electronics | HBM squeeze + foundry (lagging TSMC) | Whether foundry share stabilizes as memory offsets weakness |
| Intel | Reshoring (direct, Ohio) but declining core share | Whether federal equity stake translates to competitive turnaround |
| Micron | HBM supply squeeze | $200B domestic investment execution against reshoring tailwind |
| Texas Instruments | Reshoring (direct, Sherman TX) | Analog demand recovery pace, less AI-exposed than peers |
| Broadcom | AI/custom ASIC demand | Direct beneficiary of hyperscaler GPU diversification |
Source: Navadhi Market Research, Global Semiconductor Industry Strategic Research Report; WSTS; SIA; TrendForce.
Analyst Insight
The most consequential number in this report for competitive assessment purposes isn't the $3,011.1 billion 2031 total - it's the fact that North America's share is projected to rise from 33.0% to 41.1% while only three CHIPS Act-funded fabs had even reached volume production as of mid-2026. Most of the reshoring capacity that will drive this shift is still under construction, not yet reflected in current results. A company or investor positioned around today's manufacturing geography is underwriting an assumption - that Asia-Pacific's dominance is structural rather than partly a function of where capacity happened to exist as of 2025 - that this report's own data directly contradicts. The same logic applies to memory: SK Hynix's 37% growth rate isn't a one-off, it's the visible symptom of a supply constraint that WSTS expects to nearly quadruple Memory category revenue in 2026 alone.
Strategic Lessons for Market Participants
| Observation | Strategic Implication |
|---|---|
| North America's share is rising sharply (33.0% to 41.1%, 2025-2031) while most of the underlying fab capacity is still under construction | Supply chain and investment decisions anchored to current manufacturing geography should account for a structural shift already confirmed in WSTS's own regional data, not treat Asia-Pacific dominance as permanent |
| HBM demand substantially exceeds supply across all three major memory suppliers | Memory-exposed companies are operating in a supply-constrained pricing environment structurally different from the rest of the industry - margin assumptions should reflect that distinction explicitly |
| TSMC's foundry share is widening even as Intel receives the majority of policy and media attention | Competitive assessments should track TSMC's actual trajectory directly rather than inferring foundry market dynamics from Intel-focused coverage |
| Only 3 of the announced CHIPS Act-funded fabs were in volume production as of mid-2026 | The reshoring story is still in its early innings - planning horizons should extend through at least 2029-2030 before assuming the shift has fully played out |
Frequently Asked Questions
What is the size of the global semiconductor market?
The market reached $791.7 billion in confirmed 2025 sales, projected to reach $3,011.1 billion by 2031, a compound annual growth rate of approximately 24.9%.
Why is North America's semiconductor market share rising?
CHIPS Act-funded domestic fab capacity is beginning to come online at scale - TSMC's second Arizona fab reaches volume production in Q1 2027, with Intel's Ohio expansion and Texas Instruments' Sherman, TX facility adding further capacity through 2030. North America's share is projected to rise from 33.0% in 2025 to 41.1% by 2031.
What's driving the memory market's extraordinary growth?
High-Bandwidth Memory (HBM) demand for AI servers substantially exceeds production capacity across all three major suppliers (SK Hynix, Samsung, Micron), creating a supply-constrained pricing environment. WSTS projects Memory category revenue to surge roughly 250% year-over-year in 2026 alone.
Which companies are profiled in this report?
Twenty-five companies spanning the full value chain, including Nvidia, TSMC, Samsung Electronics, SK Hynix, Intel, Broadcom, Micron, Qualcomm, ASML, and Texas Instruments among the top 10 by revenue, alongside equipment makers, additional foundries, and analog/automotive-focused IDMs.
Is TSMC's foundry dominance increasing or decreasing?
Increasing. TSMC's share of global foundry revenue rose from 62.8% in Q1 2024 to 72.2% in Q4 2025, according to TrendForce, even as competitive and policy attention has focused heavily on Intel's separate struggles.
For full segment, application, regional, and country-level detail, complete methodology, and all twenty-five company profiles, see our Global Semiconductor Industry Strategic Research Report. For bespoke semiconductor market analysis, commission custom research.