Global Semiconductor Industry Strategic Research Report
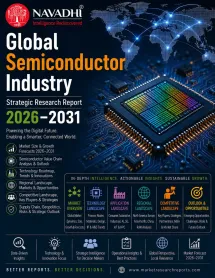
By Type: Logic, Memory, Analog, Microprocessors, Discrete Semiconductors, Optoelectronics, Sensors
By Application: Computing and Data Center, Communications and Smartphones, Consumer Electronics, Automotive, Industrial, Government and Defense, Other Applications
Regional Forecast: Asia Pacific, Latin America, MEA, Europe, North America
Key Players: Nvidia Corporation, Samsung Electronics (Semiconductor), SK Hynix, TSMC, Intel Corporation, Broadcom Inc., Micron Technology, Qualcomm Incorporated, ASML Holding, Texas Instruments, Applied Materials, Lam Research, KLA Corporation, STMicroelectronics, Infineon Technologies, NXP Semiconductors, ON Semiconductor (onsemi), Analog Devices, Marvell Technology, MediaTek, Renesas Electronics, Kioxia Holdings, GlobalFoundries, United Microelectronics Corp (UMC), Semiconductor Manufacturing International Corp (SMIC)
Overview
The global semiconductor industry achieved a landmark milestone in 2025, recording confirmed full-year sales of $791.7 billion, a 25.6% year-over-year increase and a new all-time industry revenue record, according to confirmed data from the Semiconductor Industry Association (SIA) and World Semiconductor Trade Statistics (WSTS). This performance represented the industry's second consecutive year of double-digit growth following a pronounced cyclical contraction of 8.2% in 2023, when global sales fell to $526.8 billion amid post-pandemic inventory corrections and weakening consumer electronics demand. The market is projected to reach $3,011.1 billion by 2031, representing a 2025-2031 compound annual growth rate of 24.9%.
Nvidia became the first semiconductor company in history to surpass $100 billion in annual semiconductor revenue in 2025, according to Gartner rankings, with its revenue lead over second-place Samsung Electronics widening to $53 billion and contributing more than 35% of the entire industry's incremental revenue growth for the year. SK Hynix advanced to the industry's third-largest vendor by revenue in 2025, posting 37% year-over-year growth driven almost entirely by its position as the leading global supplier of High-Bandwidth memory (HBM) to AI server manufacturers. TSMC deepened its dominance of the advanced foundry market, with its share of global foundry revenue rising from 62.8% in Q1 2024 to 72.2% in Q4 2025, according to TrendForce data.
Scope of Global Semiconductor Industry Strategic Research Report 2026-2031
- This report provides forecast data by value for the global semiconductor industry, with 2025 as the base year and forecasting to 2031.
- This report provides segmentation by type (Logic, Memory, Analog, Microprocessors, Discrete Semiconductors, Optoelectronics, Sensors) and by application (Computing and Data Center, Communications and Smartphones, Consumer Electronics, Automotive, Industrial, Government and Defense, Other Applications).
- This report provides region-wise and country-level forecast data across 5 regions and 13 countries.
- This report identifies key growth drivers and inhibitors, including the AI infrastructure investment supercycle and High-Bandwidth Memory supply-demand dynamics.
- This report provides company profiles for the 25 leading semiconductor companies, each covering Company Overview, Key Products & Segments, Financial Performance, Business Strategy, SWOT Analysis, and Strategic Implications.
- This report provides Porter's Five Forces, PESTLE, and SWOT analysis.
- This report identifies key future trends through 2031.
Segment by Type
- Logic
- Memory
- Analog
- Microprocessors
- Discrete Semiconductors
- Optoelectronics
- Sensors
Segment by Application
- Computing and Data Center
- Communications and Smartphones
- Consumer Electronics
- Automotive
- Industrial
- Government and Defense
- Other Applications
Segment by Region
- North America (United States, Canada, Rest of North America)
- Europe (Netherlands, Germany, France, Rest of Europe)
- Asia-Pacific (China, Taiwan, South Korea, Japan, India, Rest of Asia Pacific)
- Latin America (Brazil, Mexico, Rest of Latin America)
- Middle East & Africa (Israel, Rest of Middle East and Africa)
Who Can Use the Global Semiconductor Industry Strategic Research Report?
This research report is ideal for people who wish to gain a thorough understanding of the semiconductor market. Some of the intended users are:
- C-level executives and Company Directors in chip design, foundry, and equipment companies
- Investment managers, Financial professionals, and Technology sector equity analysts
- Procurement and supply chain executives at OEMs and hyperscale technology companies managing semiconductor supply risk
- Policy analysts and government affairs professionals tracking export controls and industrial policy
- Anyone operating in the global semiconductor value chain
Market snapshot
Global Semiconductor Industry Strategic Research Report snapshot, 2025–2031
 © MarketResearchReports.comDisclaimer: The actual data may vary in the final report which undergoes verification check post order confirmation.
Segments covered in this report
Table of contents
01Executive Summary
- 1.1 Market Synopsis
- 1.2 The AI Infrastructure Supercycle: Defining the 2025–2027 Period
- 1.3 Competitive Landscape: Critical Vendor Developments
- 1.4 Forecast Summary
- 1.5 Key Strategic Recommendations
02Industry Overview & Forecast
- 2.1 Market Definition & Scope
- 2.2 Historical Market Review, 2022–2025
- 2.3 Market Value Forecast, 2026–2031
- 2.4 CAGR Analysis & Interpretive Caution
- 2.5 Scenario Analysis
- 2.6 Data Provenance & Methodological Transparency
03Market Segmentation by Type
- 3.1 Segmentation Overview
- 3.2 Logic Semiconductors
- 3.3 Memory Semiconductors
- 3.4 Analog Semiconductors
- 3.5 Microprocessors
- 3.6 Discrete Semiconductors, Optoelectronics, and Sensors
- 3.7 Comparative Category Trajectory and Investment Implications
04Market Segmentation by Application
- 4.1 Application Segmentation Overview
- 4.2 Computing and Data Center
- 4.3 Communications and Smartphones
- 4.4 Consumer Electronics
- 4.5 Automotive
- 4.6 Industrial
- 4.7 Government and Defense
- 4.8 Other Applications
- 4.9 Cross-Application Growth Divergence: Strategic Implications
05Regional Market Forecast
- North America
- Europe
- Asia-Pacific
- Latin America
- Middle East & Africa
06Country-Level Market Forecast
- 6.1 North America
- 6.1.1 United States
- 6.1.2 Canada
- 6.1.3 Rest of North America
- 6.2 Europe
- 6.2.1 Netherlands
- 6.2.2 Germany
- 6.2.3 France
- 6.2.4 Rest of Europe
- 6.3 Asia-Pacific
- 6.3.1 China
- 6.3.2 Taiwan
- 6.3.3 South Korea
- 6.3.4 Japan
- 6.3.5 India
- 6.3.6 Rest of Asia Pacific
- 6.4 Latin America
- 6.4.1 Brazil
- 6.4.2 Mexico
- 6.4.3 Rest of Latin America
- 6.5 Middle East & Africa
- 6.5.1 Israel
- 6.5.2 Rest of Middle East and Africa
07Growth Drivers & Inhibitors
- 7.1 Artificial Intelligence Infrastructure Buildout
- 7.2 High-Bandwidth Memory Supply-Demand Dynamics
- 7.3 Geopolitical and Trade Policy Environment
- 7.4 Market Restraints and Growth Inhibitors
- 7.5 Opportunities and Emerging Growth Vectors
08Key Company Profiles (Nvidia Corporation, Samsung Electronics (Semiconductor), SK Hynix, TSMC, Intel Corporation, Broadcom Inc., Micron Technology, Qualcomm Incorporated, ASML Holding, Texas Instruments, Applied Materials, Lam Research, KLA Corporation, STMicroelectronics, Infineon Technologies, NXP Semiconductors, ON Semiconductor (onsemi), Analog Devices, Marvell Technology, MediaTek, Renesas Electronics, Kioxia Holdings, GlobalFoundries, United Microelectronics Corp (UMC), Semiconductor Manufacturing International Corp (SMIC))
- 8.1 Nvidia Corporation
- 8.1.1 Company Overview
- 8.1.2 Key Products & Segments
- 8.1.3 Financial Performance (2023–2025)
- 8.1.4 Business Strategy
- 8.1.5 SWOT Analysis
- 8.1.6 Strategic Implications (2025–2031)
- 8.2 Samsung Electronics (Semiconductor)
- 8.2.1 Company Overview
- 8.2.2 Key Products & Segments
- 8.2.3 Financial Performance (2023–2025)
- 8.2.4 Business Strategy
- 8.2.5 SWOT Analysis
- 8.2.6 Strategic Implications (2025–2031)
- 8.3 SK Hynix
- 8.3.1 Company Overview
- 8.3.2 Key Products & Segments
- 8.3.3 Financial Performance (2023–2025)
- 8.3.4 Business Strategy
- 8.3.5 SWOT Analysis
- 8.3.6 Strategic Implications (2025–2031)
- 8.4 TSMC
- 8.4.1 Company Overview
- 8.4.2 Key Products & Segments
- 8.4.3 Financial Performance (2023–2025)
- 8.4.4 Business Strategy
- 8.4.5 SWOT Analysis
- 8.4.6 Strategic Implications (2025–2031)
- 8.5 Intel Corporation
- 8.5.1 Company Overview
- 8.5.2 Key Products & Segments
- 8.5.3 Financial Performance (2023–2025)
- 8.5.4 Business Strategy
- 8.5.5 SWOT Analysis
- 8.5.6 Strategic Implications (2025–2031)
- 8.6 Broadcom Inc.
- 8.6.1 Company Overview
- 8.6.2 Key Products & Segments
- 8.6.3 Financial Performance (2023–2025)
- 8.6.4 Business Strategy
- 8.6.5 SWOT Analysis
- 8.6.6 Strategic Implications (2025–2031)
- 8.7 Micron Technology
- 8.7.1 Company Overview
- 8.7.2 Key Products & Segments
- 8.7.3 Financial Performance (2023–2025)
- 8.7.4 Business Strategy
- 8.7.5 SWOT Analysis
- 8.7.6 Strategic Implications (2025–2031)
- 8.8 Qualcomm Incorporated
- 8.8.1 Company Overview
- 8.8.2 Key Products & Segments
- 8.8.3 Financial Performance (2023–2025)
- 8.8.4 Business Strategy
- 8.8.5 SWOT Analysis
- 8.8.6 Strategic Implications (2025–2031)
- 8.9 ASML Holding
- 8.9.1 Company Overview
- 8.9.2 Key Products & Segments
- 8.9.3 Financial Performance (2023–2025)
- 8.9.4 Business Strategy
- 8.9.5 SWOT Analysis
- 8.9.6 Strategic Implications (2025–2031)
- 8.10 Texas Instruments
- 8.10.1 Company Overview
- 8.10.2 Key Products & Segments
- 8.10.3 Financial Performance (2023–2025)
- 8.10.4 Business Strategy
- 8.10.5 SWOT Analysis
- 8.10.6 Strategic Implications (2025–2031)
- 8.11 Applied Materials
- 8.11.1 Company Overview
- 8.11.2 Key Products & Segments
- 8.11.3 Financial Performance (2023–2025)
- 8.11.4 Business Strategy
- 8.11.5 SWOT Analysis
- 8.11.6 Strategic Implications (2025–2031)
- 8.12 Lam Research
- 8.12.1 Company Overview
- 8.12.2 Key Products & Segments
- 8.12.3 Financial Performance (2023–2025)
- 8.12.4 Business Strategy
- 8.12.5 SWOT Analysis
- 8.12.6 Strategic Implications (2025–2031)
- 8.13 KLA Corporation
- 8.13.1 Company Overview
- 8.13.2 Key Products & Segments
- 8.13.3 Financial Performance (2023–2025)
- 8.13.4 Business Strategy
- 8.13.5 SWOT Analysis
- 8.13.6 Strategic Implications (2025–2031)
- 8.14 STMicroelectronics
- 8.14.1 Company Overview
- 8.14.2 Key Products & Segments
- 8.14.3 Financial Performance (2023–2025)
- 8.14.4 Business Strategy
- 8.14.5 SWOT Analysis
- 8.14.6 Strategic Implications (2025–2031)
- 8.15 Infineon Technologies
- 8.15.1 Company Overview
- 8.15.2 Key Products & Segments
- 8.15.3 Financial Performance (2023–2025)
- 8.15.4 Business Strategy
- 8.15.5 SWOT Analysis
- 8.15.6 Strategic Implications (2025–2031)
- 8.16 NXP Semiconductors
- 8.16.1 Company Overview
- 8.16.2 Key Products & Segments
- 8.16.3 Financial Performance (2023–2025)
- 8.16.4 Business Strategy
- 8.16.5 SWOT Analysis
- 8.16.6 Strategic Implications (2025–2031)
- 8.17 ON Semiconductor (onsemi)
- 8.17.1 Company Overview
- 8.17.2 Key Products & Segments
- 8.17.3 Financial Performance (2023–2025)
- 8.17.4 Business Strategy
- 8.17.5 SWOT Analysis
- 8.17.6 Strategic Implications (2025–2031)
- 8.18 Analog Devices
- 8.18.1 Company Overview
- 8.18.2 Key Products & Segments
- 8.18.3 Financial Performance (2023–2025)
- 8.18.4 Business Strategy
- 8.18.5 SWOT Analysis
- 8.18.6 Strategic Implications (2025–2031)
- 8.19 Marvell Technology
- 8.19.1 Company Overview
- 8.19.2 Key Products & Segments
- 8.19.3 Financial Performance (2023–2025)
- 8.19.4 Business Strategy
- 8.19.5 SWOT Analysis
- 8.19.6 Strategic Implications (2025–2031)
- 8.20 MediaTek
- 8.20.1 Company Overview
- 8.20.2 Key Products & Segments
- 8.20.3 Financial Performance (2023–2025)
- 8.20.4 Business Strategy
- 8.20.5 SWOT Analysis
- 8.20.6 Strategic Implications (2025–2031)
- 8.21 Renesas Electronics
- 8.21.1 Company Overview
- 8.21.2 Key Products & Segments
- 8.21.3 Financial Performance (2023–2025)
- 8.21.4 Business Strategy
- 8.21.5 SWOT Analysis
- 8.21.6 Strategic Implications (2025–2031)
- 8.22 Kioxia Holdings
- 8.22.1 Company Overview
- 8.22.2 Key Products & Segments
- 8.22.3 Financial Performance (2023–2025)
- 8.22.4 Business Strategy
- 8.22.5 SWOT Analysis
- 8.22.6 Strategic Implications (2025–2031)
- 8.23 GlobalFoundries
- 8.23.1 Company Overview
- 8.23.2 Key Products & Segments
- 8.23.3 Financial Performance (2023–2025)
- 8.23.4 Business Strategy
- 8.23.5 SWOT Analysis
- 8.23.6 Strategic Implications (2025–2031)
- 8.24 United Microelectronics Corp (UMC)
- 8.24.1 Company Overview
- 8.24.2 Key Products & Segments
- 8.24.3 Financial Performance (2023–2025)
- 8.24.4 Business Strategy
- 8.24.5 SWOT Analysis
- 8.24.6 Strategic Implications (2025–2031)
- 8.25 Semiconductor Manufacturing International Corp (SMIC)
- 8.25.1 Company Overview
- 8.25.2 Key Products & Segments
- 8.25.3 Financial Performance (2023–2025)
- 8.25.4 Business Strategy
- 8.25.5 SWOT Analysis
- 8.25.6 Strategic Implications (2025–2031)
09Competitive Landscape
- 9.1 Competitive Landscape Overview
- 9.2 Competitive Intensity Assessment
- 9.2.1 Vendor Tier Classification by Revenue Range (FY2025)
- 9.2.2 Capacity vs. Demand Dynamics
- 9.2.3 Pricing Environment
- 9.2.4 Barriers to Entry and Exit
- 9.3 Key Player Strategies & Positioning
- 9.3.1 Strategic Group Map Narrative
- 9.3.2 Differentiation Strategies Across Major Players
- 9.3.3 Geographic Strongholds
- 9.3.4 M&A and Partnership Activity, 2022–Present
- 9.3.5 R&D and Technology Investment Trends
- 9.4 Competitive Dynamics & Strategic Outlook
- 9.4.1 Emerging Competitive Threats and Adjacent-Player Disruption
- 9.4.2 Consolidation vs. Fragmentation Outlook
- 9.4.3 Competitive Response Matrix
- 9.4.4 Strategic Recommendations for 2026–2031
10Porter's Five Forces Analysis
- 10.1 Threat of New Entrants
- 10.2 Bargaining Power of Buyers
- 10.3 Bargaining Power of Suppliers
- 10.4 Threat of Substitutes
- 10.5 Competitive Rivalry
11PESTLE Analysis
- 11.1 Political
- 11.1.1 Industrial Policy as a Structural Market Force
- 11.1.2 Export Controls and Technology Denial
- 11.1.3 Taiwan Concentration Risk and Geopolitical Exposure
- 11.2 Economic
- 11.2.1 The AI Infrastructure Investment Supercycle
- 11.2.2 Supply-Demand Imbalance in High-Bandwidth Memory
- 11.2.3 Cyclicality as a Structural Economic Risk
- 11.2.4 Revenue and Customer Concentration Risk
- 11.3 Sociological
- 11.3.1 The Democratisation of AI Demand
- 11.3.2 Workforce Scarcity as a Long-Term Structural Constraint
- 11.3.3 Public Perception and the Semiconductor Supply Chain
- 11.4 Technological
- 11.4.1 The Process Node Race and EUV Dependency
- 11.4.2 AI Accelerator Architecture Evolution
- 11.4.3 Memory Architecture Innovation
- 11.4.4 Advanced Packaging as a Competitive Differentiator
- 11.5 Legal
- 11.5.1 Export Control and Sanctions Compliance Complexity
- 11.5.2 Intellectual Property as a Competitive Moat and Litigation Risk
- 11.5.3 Antitrust Scrutiny in a Consolidating Industry
- 11.6 Environmental
- 11.6.1 Energy Intensity of AI Infrastructure
- 11.6.2 Water and Resource Consumption in Semiconductor Manufacturing
- 11.6.3 Sustainability Commitments and Supply Chain Decarbonisation Pressure
- 11.6.4 Circular Economy and Electronic Waste Considerations
- 11.7 PESTLE Summary Assessment
12SWOT Analysis
- 12.1 Strategic Context
- 12.2 Strengths
- 12.2.1 Extraordinary Revenue Momentum Anchored in Structural AI Demand
- 12.2.2 Logic and Memory Category Dominance Concentrated in Highest-Growth Applications
- 12.2.3 Foundry Capability at the Technology Frontier
- 12.2.4 HBM as a Value-Creation Engine Within the Memory Category
- 12.3 Weaknesses
- 12.3.1 Extreme Concentration of Growth in a Single Demand Driver
- 12.3.2 Intel's Structural Decline and the Erosion of U.S. IDM Capability
- 12.3.3 Foundry Access as a Binding Competitive Constraint
- 12.3.4 Segmental Divergence Creating Internal Winners and Losers
- 12.4 Opportunities
- 12.4.1 The CHIPS Act and Geopolitical Reshoring Wave
- 12.4.2 Custom ASIC as a Complement to GPU Compute
- 12.4.3 Memory Pricing Power During the HBM Supply-Constraint Period
- 12.4.4 Automotive Semiconductor Electrification and Autonomy Tailwind
- 12.4.5 Broadening AI Applications Beyond the Data Centre
- 12.5 Threats
- 12.5.1 AI Capex Deceleration and the Post-Supercycle Normalisation Risk
- 12.5.2 Geopolitical Risk and U.S.-China Technology Decoupling
- 12.5.3 Geographic Concentration of Advanced Manufacturing Capacity
- 12.5.4 Cyclical Memory Pricing Correction Risk
- 12.5.5 Talent, Energy, and Physical Infrastructure Constraints on Capacity Expansion
- 12.6 Summary Assessment
13Future Trends & Outlook
- 13.1 Structural Forces Shaping the 2026–2031 Forecast Horizon
- 13.2 AI Infrastructure Demand
- 13.3 Memory Market: HBM Capacity Expansion and Technology Transition
- 13.4 Logic and Advanced Foundry
- 13.5 Custom Silicon and the ASIC Opportunity
- 13.6 Semiconductor Equipment
- 13.7 Automotive and Industrial Semiconductors
- 13.8 Geopolitical Risk and the Reconfiguration of Global Supply Chains
- 13.9 Industry Consolidation and Competitive Structure Evolution
- 13.10 Aggregate Market Outlook: 2026–2031 Forecast Summary
Tables and figures
- 2.1 Exhibit 2.1: Forecast of Global Market YoY Growth Rate & CAGR Summary (in %)
- 2.2 Exhibit 2.2: Forecast of Global (in USD Bn)
- 2.3 Exhibit 2.3: Forecast of North America (in USD Bn)
- 2.4 Exhibit 2.4: Forecast of Europe (in USD Bn)
- 2.5 Exhibit 2.5: Forecast of Asia-Pacific (in USD Bn)
- 2.6 Exhibit 2.6: Forecast of Latin America (in USD Bn)
- 2.7 Exhibit 2.7: Forecast of Middle East & Africa (in USD Bn)
- 3.8 Exhibit 3.8: Forecast of Logic (in USD Bn)
- 3.9 Exhibit 3.9: Forecast of Memory (in USD Bn)
- 3.10 Exhibit 3.10: Forecast of Analog (in USD Bn)
- 3.11 Exhibit 3.11: Forecast of Microprocessors (in USD Bn)
- 3.12 Exhibit 3.12: Forecast of Discrete Semiconductors (in USD Bn)
- 3.13 Exhibit 3.13: Forecast of Optoelectronics (in USD Bn)
- 3.14 Exhibit 3.14: Forecast of Sensors (in USD Bn)
- 4.15 Exhibit 4.15: Forecast of Computing & Data Center (incl. AI accelerators) (in USD Bn)
- 4.16 Exhibit 4.16: Forecast of Communications & Smartphones (in USD Bn)
- 4.17 Exhibit 4.17: Forecast of Consumer Electronics (in USD Bn)
- 4.18 Exhibit 4.18: Forecast of Automotive (in USD Bn)
- 4.19 Exhibit 4.19: Forecast of Industrial (in USD Bn)
- 4.20 Exhibit 4.20: Forecast of Government & Defense (in USD Bn)
- 4.21 Exhibit 4.21: Forecast of Other (in USD Bn)
- 6.22 Exhibit 6.22: Forecast of North America (in USD Bn)
- 6.23 Exhibit 6.23: Forecast of United States (in USD Bn)
- 6.24 Exhibit 6.24: Forecast of Canada (in USD Bn)
- 6.25 Exhibit 6.25: Forecast of Rest of North America (in USD Bn)
- 6.26 Exhibit 6.26: Forecast of Europe (in USD Bn)
- 6.27 Exhibit 6.27: Forecast of Netherlands (in USD Bn)
- 6.28 Exhibit 6.28: Forecast of Germany (in USD Bn)
- 6.29 Exhibit 6.29: Forecast of France (in USD Bn)
- 6.30 Exhibit 6.30: Forecast of Rest of Europe (in USD Bn)
- 6.31 Exhibit 6.31: Forecast of Asia-Pacific (in USD Bn)
- 6.32 Exhibit 6.32: Forecast of China (in USD Bn)
- 6.33 Exhibit 6.33: Forecast of Taiwan (in USD Bn)
- 6.34 Exhibit 6.34: Forecast of South Korea (in USD Bn)
- 6.35 Exhibit 6.35: Forecast of Japan (in USD Bn)
- 6.36 Exhibit 6.36: Forecast of India (in USD Bn)
- 6.37 Exhibit 6.37: Forecast of Rest of Asia Pacific (in USD Bn)
- 6.38 Exhibit 6.38: Forecast of Latin America (in USD Bn)
- 6.39 Exhibit 6.39: Forecast of Brazil (in USD Bn)
- 6.40 Exhibit 6.40: Forecast of Mexico (in USD Bn)
- 6.41 Exhibit 6.41: Forecast of Rest of Latin America (in USD Bn)
- 6.42 Exhibit 6.42: Forecast of Middle East & Africa (in USD Bn)
- 6.43 Exhibit 6.43: Forecast of Israel (in USD Bn)
- 6.44 Exhibit 6.44: Forecast of Rest of Middle East and Africa (in USD Bn)
Frequently asked questions
What is the current size of the global semiconductor market?
What is the semiconductor market forecast to reach by 2031?
What is driving the semiconductor market's growth?
Which semiconductor product category is the largest?
Which semiconductor product category is growing fastest?
Which region leads the global semiconductor market?
Which region is growing fastest?
Who are the key companies covered in this report?
What caused the semiconductor market's 2023 downturn?
What forecast period does this report cover?
How reliable is the 2028-2031 forecast period?
What is High-Bandwidth Memory (HBM) and why does it matter for this market?
Research Methodology
All MarketResearchReports.com strategic research reports follow a rigorous, multi-stage methodology combining AI-assisted data synthesis with expert analyst validation.
Systematic collection from 500+ verified sources including SEC filings, industry databases (Bloomberg, Statista, OECD), regulatory filings, trade publications, patent databases, and company annual reports. AI-assisted extraction identifies relevant data points across 10,000+ documents per report.
Dual-validation approach: bottom-up sizing aggregates segment-level production, consumption, and trade data; top-down sizing cross-validates against macroeconomic indicators and total addressable market estimates. Discrepancies >5% trigger analyst review.
Company profiles built from public financial disclosures, product launches, M&A activity, job postings (as capability proxies), and supply chain mapping. Market share estimates triangulated across revenue, capacity, and shipment data.
CAGR projections use time-series regression on 5-10 years of historical data, adjusted for identified demand drivers (technology adoption curves, regulatory catalysts, demographic shifts) and demand inhibitors (cost barriers, substitution risk). Scenario modeling covers base, optimistic, and conservative cases.
All quantitative outputs reviewed by a domain-specialist analyst before publication. Data triangulation requires minimum 3 independent sources for every key figure. Reports undergo a structured peer review against our 47-point quality checklist covering methodology, data citations, logical consistency, and formatting standards.
On-demand reports are generated at time of purchase, incorporating the most recent available data. Static reports are republished when underlying market conditions shift by >10% from baseline assumptions. Purchasers receive update notifications for 12 months.
Related reports
 Navadhi Market Research · Semiconductors & Electronics
Global Semiconductor Advanced Packaging & Chiplet Technology Market Strategic Research Report
The global semiconductor advanced packaging and chiplet technology market is undergoing its most consequential structural transformation since the late 1990s shift f…
Navadhi Market Research · Semiconductors & ElectronicsGlobal Outsourced Semiconductor Assembly and Test (OSAT) Market Strategic Research Report
The global Outsourced Semiconductor Assembly and Test (OSAT) market is experiencing transformational growth, driven primarily by the explosive demand for Advanced Pa…
Navadhi Market Research · Semiconductors & ElectronicsGlobal MEMS Gas and Environmental Sensor Market Strategic Research Report
The global MEMS (Micro-Electro-Mechanical Systems) gas and environmental sensor market represents one of the most consequential intersections of semiconductor miniat…
Need a customized version?
Get country-, segment- or company-specific intelligence tailored to your exact requirements.
Request custom research →Request a free sample
Receive a sample of Global Semiconductor Industry Strategic Research Report before you buy.
Customize This Report
Describe your specific requirements and our analysts will scope and deliver a tailored version.
Request Invoice
We will email a proforma invoice within 24 hours. Report access is granted upon payment confirmation.
Leading Brands in This Industry