

Global Outsourced Semiconductor Assembly and Test (OSAT) Market Strategic Research Report

By Type: Advanced Packaging (Flip-Chip/2.5D/3D/CoWoS), Wire Bond Packaging, Testing Services (Final Test/Probe/Burn-In), Wafer-Level Packaging (WLCSP/FO-WLP/Panel), System-in-Package (SiP) & Heterogeneous Int.
By Application: Computing / AI / HPC, Mobile & Communications, Automotive & EV, Consumer Electronics, Industrial & IoT, Memory Packaging & Test
Regional Forecast: Asia Pacific, Latin America, MEA, Europe, North America
Key Players: ASE Technology, Amkor Technology, JCET Group, Tongfu Microelectronics, Powertech Technology, HT-Tech / Huatian Tech, WiseRoad Capital, Hana Micron, KYEC, ChipMOS
Overview
The global Outsourced Semiconductor Assembly and Test (OSAT) market is experiencing transformational growth, driven primarily by the explosive demand for Advanced Packaging solutions required for Artificial Intelligence (AI) and High-Performance Computing (HPC). As semiconductor scaling reaches physical limits, OSAT providers have become the primary engines of innovation through heterogeneous integration and complex testing services.
This report covers the full spectrum of the OSAT market across all major global markets for the forecast period 2026–2031, with 2025 as the base year. As per this report's findings, the global OSAT market, which was worth USD 52.00 billion in 2025, is expected to grow at a CAGR of 9.00% between 2026 and 2031. This growth is fueled by a structural shift toward advanced silicon integration and the expansion of the "AI-Foundry" ecosystem.
The global OSAT market is expected to be worth USD 87.22 billion by 2031. The market's Average Selling Price (ASP) Index, which is pegged at 100 in 2025, is projected to reach 116 by 2031. This upward trend reflects a significant mix shift toward high-value advanced packaging services, such as 2.5D, 3D, and CoWoS, which command higher margins than traditional wire bonding. Advanced Packaging (including Flip-Chip, 2.5D, 3D, and CoWoS) is the fastest-growing segment type, holding an estimated 25.92% market share by value in 2026 and expected to grow at a CAGR of 13.00% through 2031. This segment is the critical enabler for leading-edge GPU and accelerator production. Wire Bond Packaging remains the largest segment by revenue in 2026 with a 34.35% share, though it is maturing with a steady 4.00% CAGR. Testing Services (Final Test, Probe, and Burn-In) represent the third-largest segment, expanding at an 8.50% CAGR to reach USD 16.12 billion by 2031. Global OSAT market is expected to be worth USD 87.22 billion by 2031.
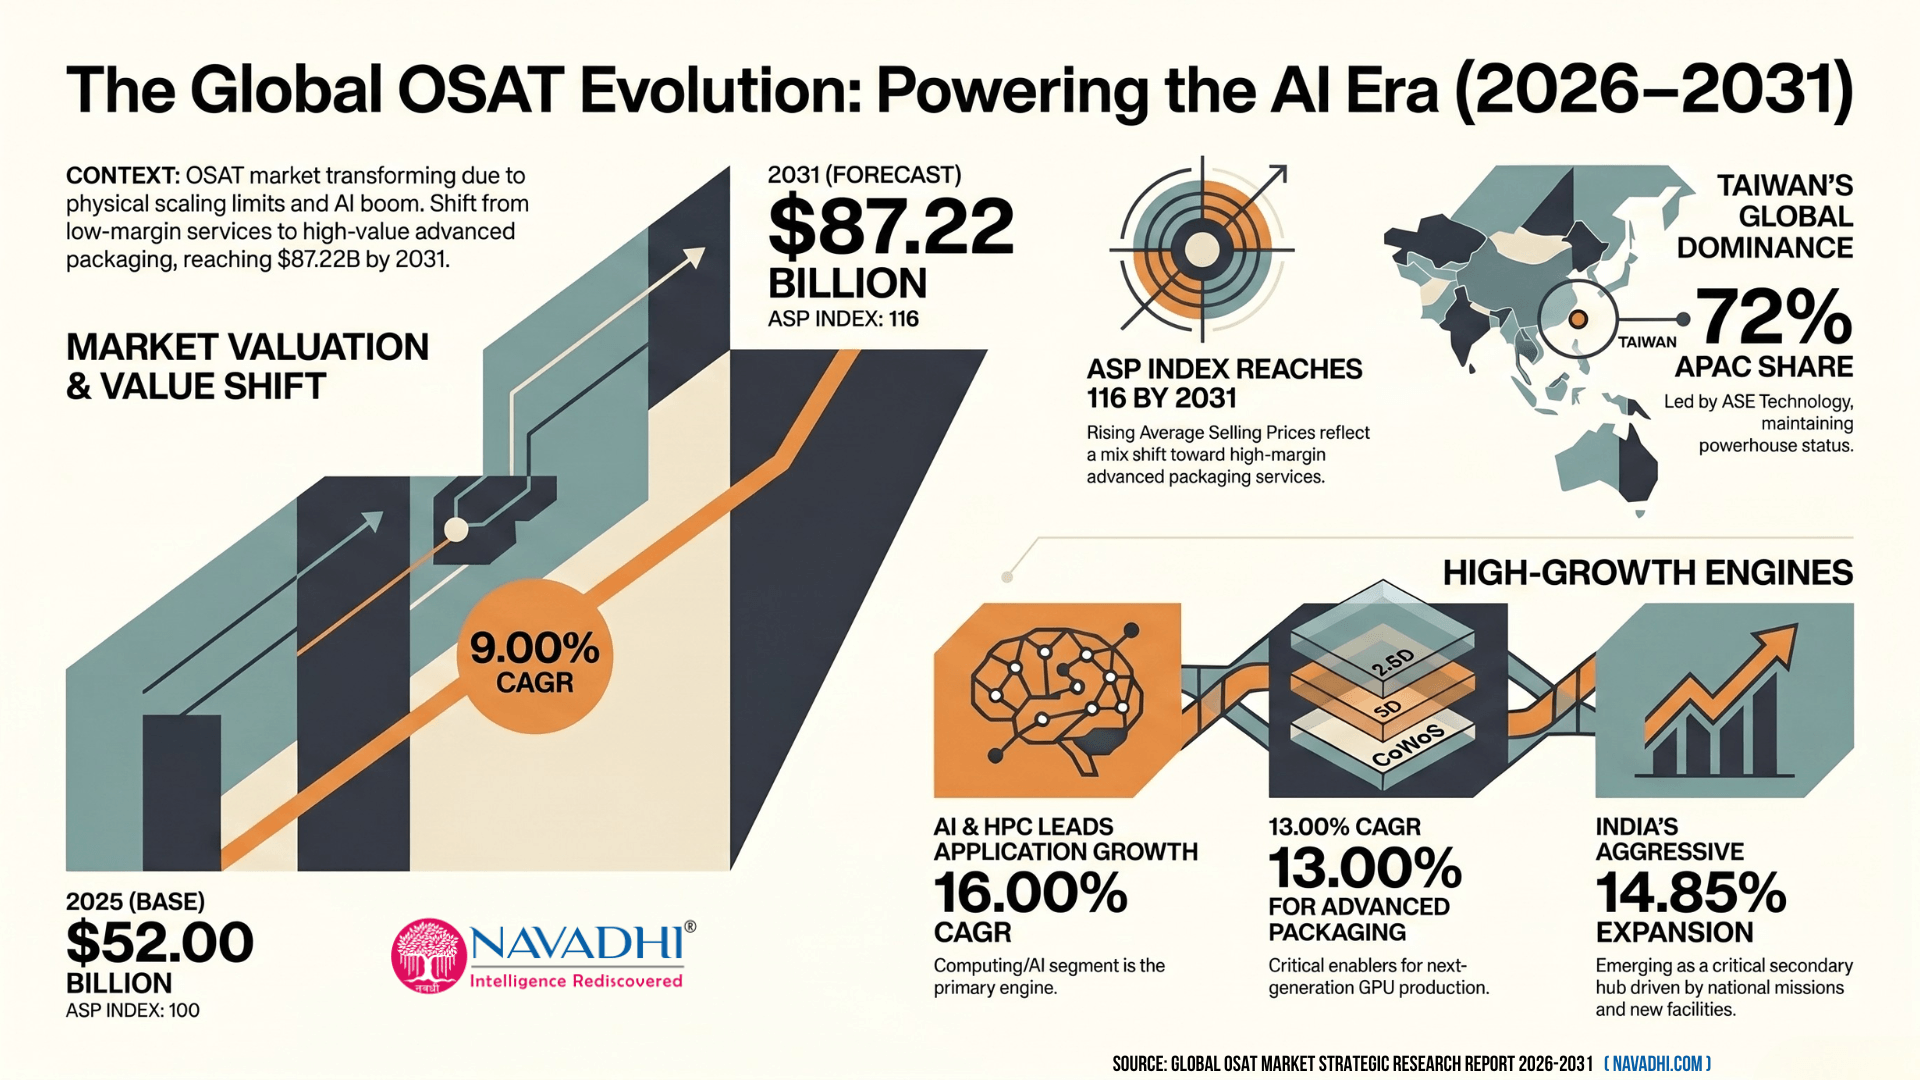
Computing / AI / HPC applications are the primary growth engine at the application level, expected to grow at the highest CAGR of 16.00%. By 2031, this segment will account for USD 20.27 billion, nearly doubling its 2026 value. Mobile & Communications remains the largest application by value, capturing 35.17% of the market in 2026, while Automotive & EV follows with a high-growth trajectory of 12.00% CAGR.
Asia-Pacific dominates the global landscape, expected to hold a 72.13% value market share in 2026. Taiwan remains the global powerhouse, anchored by ASE Technology, which accounts for approximately 38% of the global OSAT cluster. However, China is the fastest-growing major market in the region, with JCET Group and Tongfu Microelectronics benefiting from domestic semiconductor self-sufficiency goals. India is emerging as a critical secondary hub in Asia-Pacific, with the market expected to grow at an aggressive 14.85% CAGR between 2026 and 2031, driven by the India Semiconductor Mission (ISM) and new facilities from players like CG Power/Renesas and Kaynes Semi. Malaysia and Vietnam continue to serve as vital secondary clusters for mainstream packaging and testing.
In the North America OSAT market, the United States dominates regional value, supported by Amkor Technology’s advanced SiP and Flip-Chip capabilities. The region benefits from high-value AI chip design proximity and government-backed "CHIPS Act" incentives. In Europe, Germany and France lead the market, focusing on specialized automotive and industrial OSAT services for the regional EV supply chain. Consolidation in the global OSAT market is accelerating as capital expenditure requirements for advanced packaging skyrocket. ASE Technology remains the market leader with projected 2031 revenues of USD 33.45 billion, while JCET Group is gaining ground with a 14.05% CAGR, the highest among top-tier global players.
Scope of Global OSAT Market Strategic Research Report 2026-2031
- This report provides forecast data by value (in USD billion) till 2031 for the global OSAT market.
- This report provides Segment by Type (Advanced Packaging (Flip-Chip/2.5D/3D/CoWoS), Wire Bond Packaging, Testing Services (Final Test/Probe/Burn-In), and Wafer-Level Packaging (WLCSP/FO-WLP/Panel)) forecast data by value for the global OSAT market till 2031.
- This report provides Application Segments (Computing / AI / HPC, Mobile & Communications, Automotive & EV, Consumer Electronics, and Industrial / Medical / Other) forecast data by value for the global OSAT market till 2031.
- This report provides Region-wise (Asia-Pacific, North America, Europe, Latin America, and the Middle East & Africa) forecast data by value for the global OSAT market till 2031.
- This report also provides Country-wise forecast data by value for Taiwan, China, South Korea, Malaysia, India, Rest of Asia-Pacific, United States, Canada, Rest of North America, Germany, France, United Kingdom, Rest of Europe, Brazil, Mexico, Rest of Latin America, Saudi Arabia, UAE, and Rest of MEA.
- This report identifies key Market Assumptions, growth drivers, inhibitors, and technical trends such as the ASP Index shift.
- This report provides a Company Revenue Tracker including revenue (in USD billion) and CAGR for 2024-2031 for key companies: ASE Technology, Amkor Technology, JCET Group, Tongfu Microelectronics, Powertech Technology (PTI), KYEC (King Yuan Electronics), ChipMOS Technologies, UTAC Holdings, and Ardentec.
- This report provides CAGR Verification across all segments to ensure the mathematical accuracy of market projections.
- This report provides Porter's Five Forces analysis for the global OSAT market.
- This report provides a PESTLE (political, economic, social, technological, legal, and environmental) analysis for the global OSAT market.
- This report identifies key future trends in the global OSAT market.
Segment by Type in the Global OSAT Market
- Advanced Packaging (Flip-Chip/2.5D/3D/CoWoS)
- Wire Bond Packaging
- Testing Services (Final Test/Probe/Burn-In)
- Wafer-Level Packaging (WLCSP/FO-WLP/Panel)
- System-in-Package (SiP) & Heterogeneous Int.
Segment by Application in Global OSAT Market
- Computing / AI / HPC
- Mobile & Communications
- Automotive & EV
- Consumer Electronics
- Industrial & IoT
- Memory Packaging & Test
Segment by Region and Country in the Global OSAT Market
Asia-Pacific
- Taiwan
- China
- South Korea
- Japan
- India
- Malaysia
- Vietnam
- Rest of ASEAN
- Rest of Asia Pacific
North America
- USA
- Canada
Europe
- Germany
- Portugal
- United Kingdom
- France
- Netherlands
- Italy
- Switzerland
- Sweden
- Rest of Europe
Middle East & Africa
- Saudi Arabia
- UAE
- Israel
- South Africa
- Egypt
- Rest of Middle East & Africa
Latin America
- Brazil
- Mexico
- Chile
- Colombia
- Rest of Latin America
Who can use the Global OSAT Market Research Report?
- C-level executives at Fabless and IDM companies
- Investment managers and Venture Capitalists in the semiconductor sector
- Strategic sourcing and procurement professionals
- Business development and marketing professionals at OSAT and EMS firms
- Industry consultants and financial analysts covering the silicon supply chain
Market snapshot
Global Outsourced Semiconductor Assembly and Test (OSAT) Market Strategic Research Report snapshot, 2025–2031
 © MarketResearchReports.comDisclaimer: The actual data may vary in the final report which undergoes verification check post order confirmation.
Segments covered in this report
Table of contents
01Executive Summary
- 1.1 Executive Summary
- 1.1.1 Market Definition and Structural Context
- 1.1.2 Market Size, Growth Rate, and Forecast Headline
- 1.1.3 Three Structural Growth Vectors Defining the 2026–2031 Forecast
- 1.1.4 Technology Segmentation — Key Findings
- 1.1.5 Application Segmentation — Key Findings
- 1.1.6 Regional and Geographic Analysis — Key Structural Updates
- 1.1.7 Competitive Landscape — Key Observations
- 1.1.8 Key Metrics Summary — Executive Dashboard
02Industry Overview & Forecast
- 2.1 Market Definition and Structural Context
- 2.1.1 Methodology and Market Construction
- 2.1.2 Overall Market Size and Forecast 2025–2031
- 2.1.3 The Advanced Packaging Mix Shift: The Central Structural Theme
- 2.1.4 Segment Forecast by Technology Type
- 2.1.5 Segment Forecast by Application
- 2.1.6 Regional Forecast Summary
- 2.1.7 Key Quantitative Assumptions Underpinning the Forecast
- 2.1.8 Forecast Confidence and Key Risks
03Market Segmentation by Type
- 3.1 Market Segmentation by Technology Type
- 3.1.1 Segment Overview and Structural Framework
- 3.1.2 Advanced Packaging (Flip-Chip / 2.5D / 3D / CoWoS)
- 3.1.3 Wire Bond Packaging
- 3.1.4 Testing Services (Final Test / Probe / Burn-In)
- 3.1.5 Wafer-Level Packaging (WLCSP / FO-WLP / Panel-Level)
- 3.1.6 System-in-Package (SiP) & Heterogeneous Integration
- 3.1.7 Segment Mix Shift Analysis: The Advanced Packaging Inflection
- 3.1.8 Competitive Positioning by Segment
04Market Segmentation by Application
- 4.1 Overview and Segmentation Framework
- 4.2 Computing / AI / HPC — Fastest-Growing Segment
- 4.2.1 Market Size and Growth Trajectory
- 4.2.2 Structural Demand Drivers
- 4.2.3 Competitive Dynamics
- 4.3 Mobile & Communications — Largest Segment in Structural Deceleration
- 4.3.1 Market Size and Growth Trajectory
- 4.3.2 Structural Demand Drivers
- 4.3.3 Competitive Dynamics
- 4.4 Automotive & EV — Second-Fastest-Growing Segment
- 4.4.1 Market Size and Growth Trajectory
- 4.4.2 Structural Demand Drivers
- 4.5 Consumer Electronics — Mature Stability
- 4.5.1 Market Size and Growth Trajectory
- 4.5.2 Structural Demand Drivers
- 4.6 Industrial & IoT — Steady Compounding Above Market Average
- 4.6.1 Market Size and Growth Trajectory
- 4.6.2 Structural Demand Drivers
- 4.7 Memory Packaging & Test — HBM Reacceleration from a Small Base
- 4.7.1 Market Size and Growth Trajectory
- 4.7.2 Structural Demand Drivers
- 4.8 Cross-Segment Analysis: Share Shift and Market Structure Evolution
- 4.8.1 Advanced Packaging Penetration by Application Segment
- 4.9 Segment Summary and Investment Implications
05Regional Market Forecast
- 5.1 Asia-Pacific
- 5.1.1 Regional Overview
- 5.1.2 Key Growth Drivers
- 5.1.3 Regulatory & Infrastructure Landscape
- 5.1.4 Country-Level Analysis
- 5.1.5 Market Forecast 2025–2031
- 5.2 North America
- 5.2.1 Regional Overview
- 5.2.2 Key Growth Drivers
- 5.2.3 Regulatory & Infrastructure Landscape
- 5.2.4 Country-Level Analysis
- 5.2.5 Market Forecast 2025–2031
- 5.3 Europe
- 5.3.1 Regional Overview
- 5.3.2 Key Growth Drivers
- 5.3.3 Regulatory & Infrastructure Landscape
- 5.3.4 Country-Level Analysis
- 5.3.5 Market Forecast 2025–2031
- 5.3.5.1 Exhibit: Europe OSAT Market Forecast 2025–2031
- 5.4 Middle East & Africa
- 5.4.1 Regional Overview
- 5.4.2 Key Growth Drivers
- 5.4.3 Regulatory & Infrastructure Landscape
- 5.4.4 Country-Level Analysis
- 5.4.5 Market Forecast 2025–2031
- 5.5 Latin America
- 5.5.1 Regional Overview
- 5.5.2 Key Growth Drivers
- 5.5.3 Regulatory & Infrastructure Landscape
- 5.5.4 Country-Level Analysis
- 5.5.5 Market Forecast 2025–2031
06Country-Level Market Forecast
- 6.1 Asia-Pacific
- 6.1.1 Taiwan
- 6.1.1.1 Market Overview
- 6.1.1.2 Key OSAT Players in Taiwan
- 6.1.1.3 Advanced Packaging Capacity
- 6.1.1.4 Government Policy & Support
- 6.1.1.5 2025–2031 Outlook
- 6.1.1.6 Market Size and Growth Outlook
- 6.1.2 China
- 6.1.3 South Korea
- 6.1.4 Japan
- 6.1.5 India
- 6.1.6 Malaysia
- 6.1.7 Vietnam
- 6.1.8 Remaining ASEAN
- 6.1.9 Rest of APAC
- 6.2 North America
- 6.2.1 United States
- 6.2.2 Canada
- 6.3 Europe
- 6.3.1 Germany
- 6.3.2 Portugal
- 6.3.3 United Kingdom
- 6.3.4 France
- 6.4 Conclusion: France Competitive Dynamics, Risk Factors, and 2031 Outlook
- 6.4.1 Competitive Landscape and Domestic Market Structure
- 6.4.2 Regulatory and Policy Risk Factors
- 6.4.3 Technology Development Trajectory and Investment Requirements
- 6.4.4 Financial Performance Characteristics and Margin Structure
- 6.4.5 Outlook and Strategic Positioning
- 6.4.6 Netherlands
- 6.4.7 Italy
- 6.4.8 Switzerland
- 6.4.9 Sweden
- 6.4.10 Rest of Europe
- 6.5 Middle East & Africa
- 6.5.1 Saudi Arabia
- 6.5.2 United Arab Emirates
- 6.5.3 Israel
- 6.5.4 South Africa
- 6.5.5 Egypt
- 6.5.6 Rest of MEA
- 6.6 Latin America
- 6.6.1 Brazil
- 6.6.2 Mexico
- 6.6.3 Colombia
- 6.6.4 Chile
- 6.6.5 Rest of Latin America
07Growth Drivers & Inhibitors
- 7.1 Section 11: Growth Drivers and Inhibitors
- 7.1.1 Section Overview and Analytical Framework
- 7.1.2 Primary Growth Drivers
- 7.1.2.1 Driver 1: The AI Semiconductor Supercycle — Structural Demand for Advanced Packaging
- 7.1.2.2 Driver 2: Electric Vehicle Transition — Automotive Semiconductor Content Multiplication
- 7.1.2.3 Driver 3: Progressive IDM Outsourcing of Advanced Packaging Operations
- 7.1.2.4 Driver 4: Geopolitical Supply Chain Diversification — Friend-Shoring and Regional Manufacturing Build-Out
- 7.1.2.5 Driver 5: Heterogeneous Integration and Chiplet Architecture Adoption
- 7.1.2.6 Driver 6: Consumer Electronics Refresh Cycle and Wearable/IoT Proliferation
- 7.1.3 Primary Growth Inhibitors
- 7.1.3.1 Inhibitor 1: In-House Advanced Packaging by Leading Foundries — Competitive Displacement Risk
- 7.1.3.2 Inhibitor 2: China OSAT Overcapacity — Wire Bond Commoditisation and Pricing Pressure
- 7.1.3.3 Inhibitor 3: Geopolitical Risk — Export Controls, Entity List Designations, and Supply Chain Bifurcation
- 7.1.3.4 Inhibitor 4: Capital Intensity Escalation — Advanced Packaging Infrastructure Investment Requirements
- 7.1.3.5 Inhibitor 5: Macroeconomic Cyclicality and Customer Inventory Dynamics
- 7.1.4 Quantitative Summary: Driver and Inhibitor Impact Matrix
- 7.1.5 Synthesis and Strategic Implications
08Company Profiles
- 8.1 ASE Technology Holding (ASE Group)
- 8.1.1 Company Overview
- 8.1.2 Financial Performance
- 8.1.3 Product Portfolio
- 8.1.4 Geographic Presence
- 8.1.5 Business Strategy
- 8.1.6 SWOT Analysis
- 8.1.7 Recent Developments
- 8.2 Amkor Technology
- 8.2.1 Company Overview
- 8.2.2 Financial Performance
- 8.2.3 Product Portfolio
- 8.2.4 Geographic Presence
- 8.2.5 Business Strategy
- 8.2.6 SWOT Analysis
- 8.2.7 Recent Developments
- 8.3 JCET Group
- 8.3.1 Company Overview
- 8.3.2 Financial Performance
- 8.3.3 Product Portfolio
- 8.3.4 Geographic Presence
- 8.3.5 Business Strategy
- 8.3.6 SWOT Analysis
- 8.3.7 Recent Developments
- 8.4 Tongfu Microelectronics (TFME)
- 8.4.1 Company Overview
- 8.4.2 Financial Performance
- 8.4.3 Product Portfolio
- 8.4.4 Geographic Presence
- 8.4.5 Business Strategy
- 8.4.6 SWOT Analysis
- 8.4.7 Recent Developments
- 8.5 Powertech Technology Inc. (PTI)
- 8.5.1 Company Overview
- 8.5.2 Financial Performance (2024–2025)
- 8.5.3 Product Portfolio
- 8.5.4 Geographic Presence
- 8.5.5 Business Strategy
- 8.5.6 SWOT Analysis
- 8.5.7 Recent Developments
- 8.6 Huatian Technology (HT-Tech)
- 8.6.1 Company Overview
- 8.6.2 Financial Performance (2024–2025)
- 8.6.3 Product Portfolio
- 8.6.4 Geographic Presence
- 8.6.5 Business Strategy
- 8.6.6 SWOT Analysis
- 8.6.7 Recent Developments
- 8.7 WiseRoad Capital
- 8.7.1 Company Overview
- 8.7.2 Financial Performance
- 8.7.3 Product Portfolio
- 8.7.4 Geographic Presence
- 8.7.5 Business Strategy
- 8.7.6 SWOT Analysis
- 8.7.7 Recent Developments
- 8.8 Hana Micron
- 8.8.1 Company Overview
- 8.8.2 Financial Performance
- 8.8.3 Product Portfolio
- 8.8.4 Geographic Presence
- 8.8.5 Business Strategy
- 8.8.6 SWOT Analysis
- 8.8.7 Recent Developments
- 8.9 KYEC (King Yuan Electronics)
- 8.9.1 Company Overview
- 8.9.2 Financial Performance
- 8.9.3 Product Portfolio
- 8.9.4 Geographic Presence
- 8.9.5 Business Strategy
- 8.9.6 SWOT Analysis
- 8.9.7 Recent Developments
- 8.10 ChipMOS Technologies
- 8.10.1 Company Overview
- 8.10.2 Financial Performance
- 8.10.3 Product Portfolio
- 8.10.4 Geographic Presence
- 8.10.5 Business Strategy
09Competitive Landscape
- 9.1 Competitive Landscape Overview
- 9.1.1 Table 1: Top 5 OSAT Providers — Revenue, Market Share & Strategic Positioning (FY2024)
- 9.1.2 Concentration Metrics and Competitive Intensity
- 9.2 Competitive Intensity Assessment
- 9.2.1 Tier Structure and Revenue Segmentation
- 9.2.2 Capacity vs. Demand Dynamics
- 9.2.3 Pricing Environment
- 9.2.4 Barriers to Entry and Exit
- 9.3 Key Player Strategies & Positioning
- 9.3.1 Strategic Group Framework
- 9.3.2 Tier 1: Global Champions
- 9.3.2.1 ASE Technology Holding Co., Ltd. (Taiwan)
- 9.3.2.2 Amkor Technology, Inc. (Headquarters: Tempe, Arizona, USA; Primary Operations: South Korea, Vietnam, Portugal)
- 9.3.2.3 JCET Group Co., Ltd. (China)
- 9.3.3 Tier 2: Regional Specialists
- 9.3.3.1 Powertech Technology Inc. (PTI) (Taiwan)
- 9.3.3.2 UTAC Group (Singapore)
- 9.3.3.3 HT-Tech / Hua Tian Technology (China)
- 9.3.3.4 Malaysian Pacific Industries (MPI) (Malaysia)
- 9.3.4 Tier 3: Substrate and Interconnect Specialists
- 9.3.4.1 Ibiden Co., Ltd. (Japan)
- 9.3.4.2 Shinko Electric Industries Co., Ltd. (Japan)
- 9.3.5 Comparative Strategic Positioning Table
- 9.3.6 Cross-Cutting Strategic Themes
- 9.4 Competitive Dynamics & Strategic Outlook
- 9.4.1 Consolidation Trends and Market Structure
- 9.4.2 IDM Insourcing as a Structural Threat
- 9.4.3 China Domestic OSAT Growth Trajectory
- 9.4.4 CoWoS and Advanced Packaging as the Central Competitive Battleground
- 9.4.5 Competitive Positioning Matrix: Key OSAT Players (2024–2026 Outlook)
- 9.4.6 Strategic Implications for 2025–2031
10Porter's Five Forces Analysis
- 10.1 Threat of New Entrants
- 10.2 Bargaining Power of Buyers
- 10.2.1 Key Factors
- 10.2.2 Market-Specific Context
- 10.2.3 Trend: Strengthening in Standard Packaging; Moderating in Advanced Packaging — Net Effect: Stable
- 10.2.4 Strategic Implication
- 10.3 Bargaining Power of Suppliers
- 10.3.1 Key Factors
- 10.3.2 Market-Specific Context
- 10.3.3 Trend
- 10.3.4 Strategic Implication
- 10.4 Threat of Substitutes
- 10.5 Competitive Rivalry
11PESTLE Analysis
- 11.1 Global Outsourced Semiconductor Assembly and Test (OSAT) Market: PESTLE Analysis 2026–2031
- 11.2 Political Factors
- 11.2.1 Semiconductor Geopolitics and Industrial Policy as a Market-Shaping Force
- 11.2.2 US–China Technology Decoupling and Dual-Ecosystem Formation
- 11.2.3 Taiwan Geopolitical Risk — The Industry's Existential Political Variable
- 11.2.4 Regional Political Incentive Landscapes
- 11.3 Economic Factors
- 11.3.1 Macroeconomic Context and Semiconductor Cycle Dynamics
- 11.3.2 Capital Expenditure Economics and Capacity Constraints
- 11.3.3 Currency Economics and Cost Structure Considerations
- 11.3.4 Labour Cost Economics and Geographic Arbitrage Evolution
- 11.4 Sociological Factors
- 11.4.1 AI Integration and Societal Demand Transformation
- 11.4.2 Workforce Development and Talent Ecosystem Requirements
- 11.4.3 ESG Imperatives and Social Licence to Operate
- 11.5 Technological Factors
- 11.5.1 Advanced Packaging as Technological Necessity, Not Option
- 11.5.2 Test Technology Intensification
- 11.5.3 AI-Enabled Manufacturing and Industry 4.0 Integration
- 11.6 Legal and Regulatory Factors
- 11.6.1 Export Control Regimes and Technology Access Regulation
- 11.6.2 CHIPS Act Compliance and Domestic Content Requirements
- 11.6.3 Environmental Regulation and Chemical Compliance
- 11.6.4 Intellectual Property and Technology Licensing Frameworks
- 11.7 Environmental Factors
- 11.7.1 Energy Consumption and Carbon Footprint
- 11.7.2 Water Consumption and Scarcity Risk
- 11.7.3 Supply Chain Environmental Risk and Climate Resilience
- 11.8 PESTLE Summary Matrix
- 11.9 Integrated PESTLE Assessment
12SWOT Analysis
- 12.1 Global Outsourced Semiconductor Assembly and Test (OSAT) Market
- 12.1.1 Strategic Assessment 2026–2031
- 12.2 Overview and Methodology
- 12.3 S — Strengths
- 12.3.1 S1. Structural Technology Indispensability in AI-Era Semiconductor Manufacturing
- 12.3.2 S2. Scale, Capital Depth, and Process Expertise of Market Leaders
- 12.3.3 S3. Diversified Customer Base Across High-Growth Application Verticals
- 12.3.4 S4. Government-Backed Demand Floor Through CHIPS Act and Equivalent Policies
- 12.3.5 S5. Advanced SiP and Heterogeneous Integration as High-Margin Growth Vectors
- 12.4 W — Weaknesses
- 12.4.1 W1. Extreme Customer Concentration Risk Among Tier-One Providers
- 12.4.2 W2. Constrained Bargaining Power Against Tier-One Foundry Customers
- 12.4.3 W3. High Capital Intensity with Extended Payback Periods
- 12.4.4 W4. Geographic Concentration of Advanced Packaging Capability in Geopolitically Exposed Regions
- 12.4.5 W5. Technology Transition Risk: Wire Bond Installed Base at Structural Disadvantage
- 12.5 O — Opportunities
- 12.5.1 O1. AI Semiconductor Supercycle: Unprecedented Demand Surge for Advanced Packaging
- 12.5.2 O2. EV and Automotive Electrification Multiplying Semiconductor Content Per Vehicle
- 12.5.3 O3. IDM Outsourcing Wave: Structural Expansion of Addressable Market
- 12.5.4 O4. Geographic Diversification: Vietnam, Malaysia, and US as Emerging Capacity Hubs
- 12.5.5 O5. HBM and Memory Packaging as a High-ASP Adjacent Opportunity
- 12.5.6 O6. IoT, Edge AI, and Wearables: Expanding SiP Addressable Market
- 12.6 T — Threats
- 12.6.1 T1. Foundry In-House Advanced Packaging: TSMC, Samsung, and Intel Foundry as Direct Competitors
- 12.6.2 T2. China OSAT Overcapacity: Structural Wire Bond Overcapacity and Price Erosion Risk
- 12.6.3 T3. US-China Geopolitical Escalation and Export Control Risk
- 12.6.4 T4. Customer Insourcing: Apple, Hyperscalers, and AI Hardware Companies
- 12.6.5 T5. Technology Disruption: Chiplet Standards, Interoperability, and New Entrant Risk
- 12.6.6 T6. Macroeconomic and Cyclical Demand Risk: Semiconductor Inventory Corrections
- 12.7 SWOT Strategic Matrix Summary
- 12.8 Strategic Conclusions from SWOT Assessment
13Future Trends & Outlook
- 13.1 Section 10: Future Trends & Strategic Outlook — Global OSAT Market 2026–2031
- 13.1.1 Executive Outlook Summary
- 13.1.2 Trend 1: Advanced Packaging Becomes the Dominant Revenue Architecture — The Single Most Important Structural Shift in OSAT History
- 13.1.3 Trend 2: Heterogeneous Integration and System-in-Package (SiP) Emerge as the Fastest-Growing OSAT Segment
- 13.1.4 Trend 3: AI/HPC Displaces Mobile as the Largest OSAT Application Segment by 2027–2028
- 13.1.5 Trend 4: Geopolitical Restructuring of the OSAT Supply Chain — The "China + 1" and "Friend-Shoring" Imperative
- 13.1.6 Trend 5: Automotive Semiconductor Packaging — From Recovery to Structural Growth Engine
- 13.1.7 Trend 6: TSMC and IDM In-Housing of Advanced Packaging — The Most Significant Competitive Risk to the Independent OSAT Model
- 13.1.8 Trend 7: Test Complexity and System-Level Test (SLT) as a Revenue-Expanding Category
- 13.1.9 Technology and Innovation Outlook: Key Developments 2026–2031
- 13.1.10 Consolidated Trend Impact Matrix — 2026–2031
- 13.1.11 Market Forecast Sensitivity — Base, Bull, and Bear Scenarios (2031)
- 13.1.12 Strategic Conclusions for Market Participants
Tables and figures
List of Exhibits
- Exhibit 2.1: Forecast of Global (in USD Bn)
- Exhibit 2.2: Forecast of Asia-Pacific (in USD Bn)
- Exhibit 2.3: Forecast of North America (in USD Bn)
- Exhibit 2.4: Forecast of Europe (in USD Bn)
- Exhibit 2.5: Forecast of Middle East & Africa (in USD Bn)
- Exhibit 2.6: Forecast of Latin America (in USD Bn)
- Exhibit 3.7: Forecast of Advanced Packaging (Flip-Chip/2.5D/3D/CoWoS) (in USD Bn)
- Exhibit 3.8: Forecast of Wire Bond Packaging (in USD Bn)
- Exhibit 3.9: Forecast of Testing Services (Final Test/Probe/Burn-In) (in USD Bn)
- Exhibit 3.10: Forecast of Wafer-Level Packaging (WLCSP/FO-WLP/Panel) (in USD Bn)
- Exhibit 3.11: Forecast of System-in-Package (SiP) & Heterogeneous Integration (in USD Bn)
- Exhibit 4.12: Forecast of Computing / AI / HPC (in USD Bn)
- Exhibit 4.13: Forecast of Mobile & Communications (in USD Bn)
- Exhibit 4.14: Forecast of Automotive & EV (in USD Bn)
- Exhibit 4.15: Forecast of Consumer Electronics (in USD Bn)
- Exhibit 4.16: Forecast of Industrial & IoT (in USD Bn)
- Exhibit 4.17: Forecast of Memory Packaging & Test (in USD Bn)
- Exhibit 5.18: Forecast of Asia-Pacific (in USD Bn)
- Exhibit 5.19: Forecast of Taiwan (in USD Bn)
- Exhibit 5.20: Forecast of China (in USD Bn)
- Exhibit 5.21: Forecast of South Korea (in USD Bn)
- Exhibit 5.22: Forecast of Japan (in USD Bn)
- Exhibit 5.23: Forecast of India (in USD Bn)
- Exhibit 5.24: Forecast of Malaysia (in USD Bn)
- Exhibit 5.25: Forecast of Vietnam (in USD Bn)
- Exhibit 5.26: Forecast of Remaining ASEAN (in USD Bn)
- Exhibit 5.27: Forecast of Rest of APAC (in USD Bn)
- Exhibit 5.28: Forecast of North America (in USD Bn)
- Exhibit 5.29: Forecast of United States (in USD Bn)
- Exhibit 5.30: Forecast of Canada (in USD Bn)
- Exhibit 5.31: Forecast of Europe (in USD Bn)
- Exhibit 5.32: Forecast of Germany (in USD Bn)
- Exhibit 5.33: Forecast of Portugal (in USD Bn)
- Exhibit 5.34: Forecast of United Kingdom (in USD Bn)
- Exhibit 5.35: Forecast of France (in USD Bn)
- Exhibit 5.36: Forecast of Netherlands (in USD Bn)
- Exhibit 5.37: Forecast of Italy (in USD Bn)
- Exhibit 5.38: Forecast of Switzerland (in USD Bn)
Frequently asked questions
What is the expected market size of the global OSAT market by 2031?
What is the projected CAGR for the global OSAT market between 2026 and 2031?
Which application segment is the primary growth engine for the OSAT market?
What are the fastest-growing and largest segments by type in the OSAT market?
Which region dominates the global OSAT market?
How is the Indian market performing within the OSAT sector?
Who are the key players covered in the report's revenue tracker?
What is the forecast period for the Global OSAT Market Strategic Research Report?
Research Methodology
All MarketResearchReports.com strategic research reports follow a rigorous, multi-stage methodology combining AI-assisted data synthesis with expert analyst validation.
Systematic collection from 500+ verified sources including SEC filings, industry databases (Bloomberg, Statista, OECD), regulatory filings, trade publications, patent databases, and company annual reports. AI-assisted extraction identifies relevant data points across 10,000+ documents per report.
Dual-validation approach: bottom-up sizing aggregates segment-level production, consumption, and trade data; top-down sizing cross-validates against macroeconomic indicators and total addressable market estimates. Discrepancies >5% trigger analyst review.
Company profiles built from public financial disclosures, product launches, M&A activity, job postings (as capability proxies), and supply chain mapping. Market share estimates triangulated across revenue, capacity, and shipment data.
CAGR projections use time-series regression on 5-10 years of historical data, adjusted for identified demand drivers (technology adoption curves, regulatory catalysts, demographic shifts) and demand inhibitors (cost barriers, substitution risk). Scenario modeling covers base, optimistic, and conservative cases.
All quantitative outputs reviewed by a domain-specialist analyst before publication. Data triangulation requires minimum 3 independent sources for every key figure. Reports undergo a structured peer review against our 47-point quality checklist covering methodology, data citations, logical consistency, and formatting standards.
On-demand reports are generated at time of purchase, incorporating the most recent available data. Static reports are republished when underlying market conditions shift by >10% from baseline assumptions. Purchasers receive update notifications for 12 months.
Related reports
 Navadhi Market Research · Semiconductors & Electronics
Global Semiconductor Advanced Packaging & Chiplet Technology Market Strategic Research Report
The global semiconductor advanced packaging and chiplet technology market is undergoing its most consequential structural transformation since the late 1990s shift f…
Navadhi Market Research · Semiconductors & ElectronicsGlobal MEMS Gas and Environmental Sensor Market Strategic Research Report
The global MEMS (Micro-Electro-Mechanical Systems) gas and environmental sensor market represents one of the most consequential intersections of semiconductor miniat…
Navadhi Market Research · Semiconductors & ElectronicsGlobal Satellite IoT Transceiver Chipset Market Strategic Research Report
The global satellite IoT transceiver chipset market has emerged as a critical enabler of machine-to-machine connectivity in regions where terrestrial networks remain…
Need a customized version?
Get country-, segment- or company-specific intelligence tailored to your exact requirements.
Request custom research →Request a free sample
Receive a sample of Global Outsourced Semiconductor Assembly and Test (OSAT) Market Strategic Research Report before you buy.
Customize This Report
Describe your specific requirements and our analysts will scope and deliver a tailored version.
Request Invoice
We will email a proforma invoice within 24 hours. Report access is granted upon payment confirmation.
Leading Brands in This Industry



