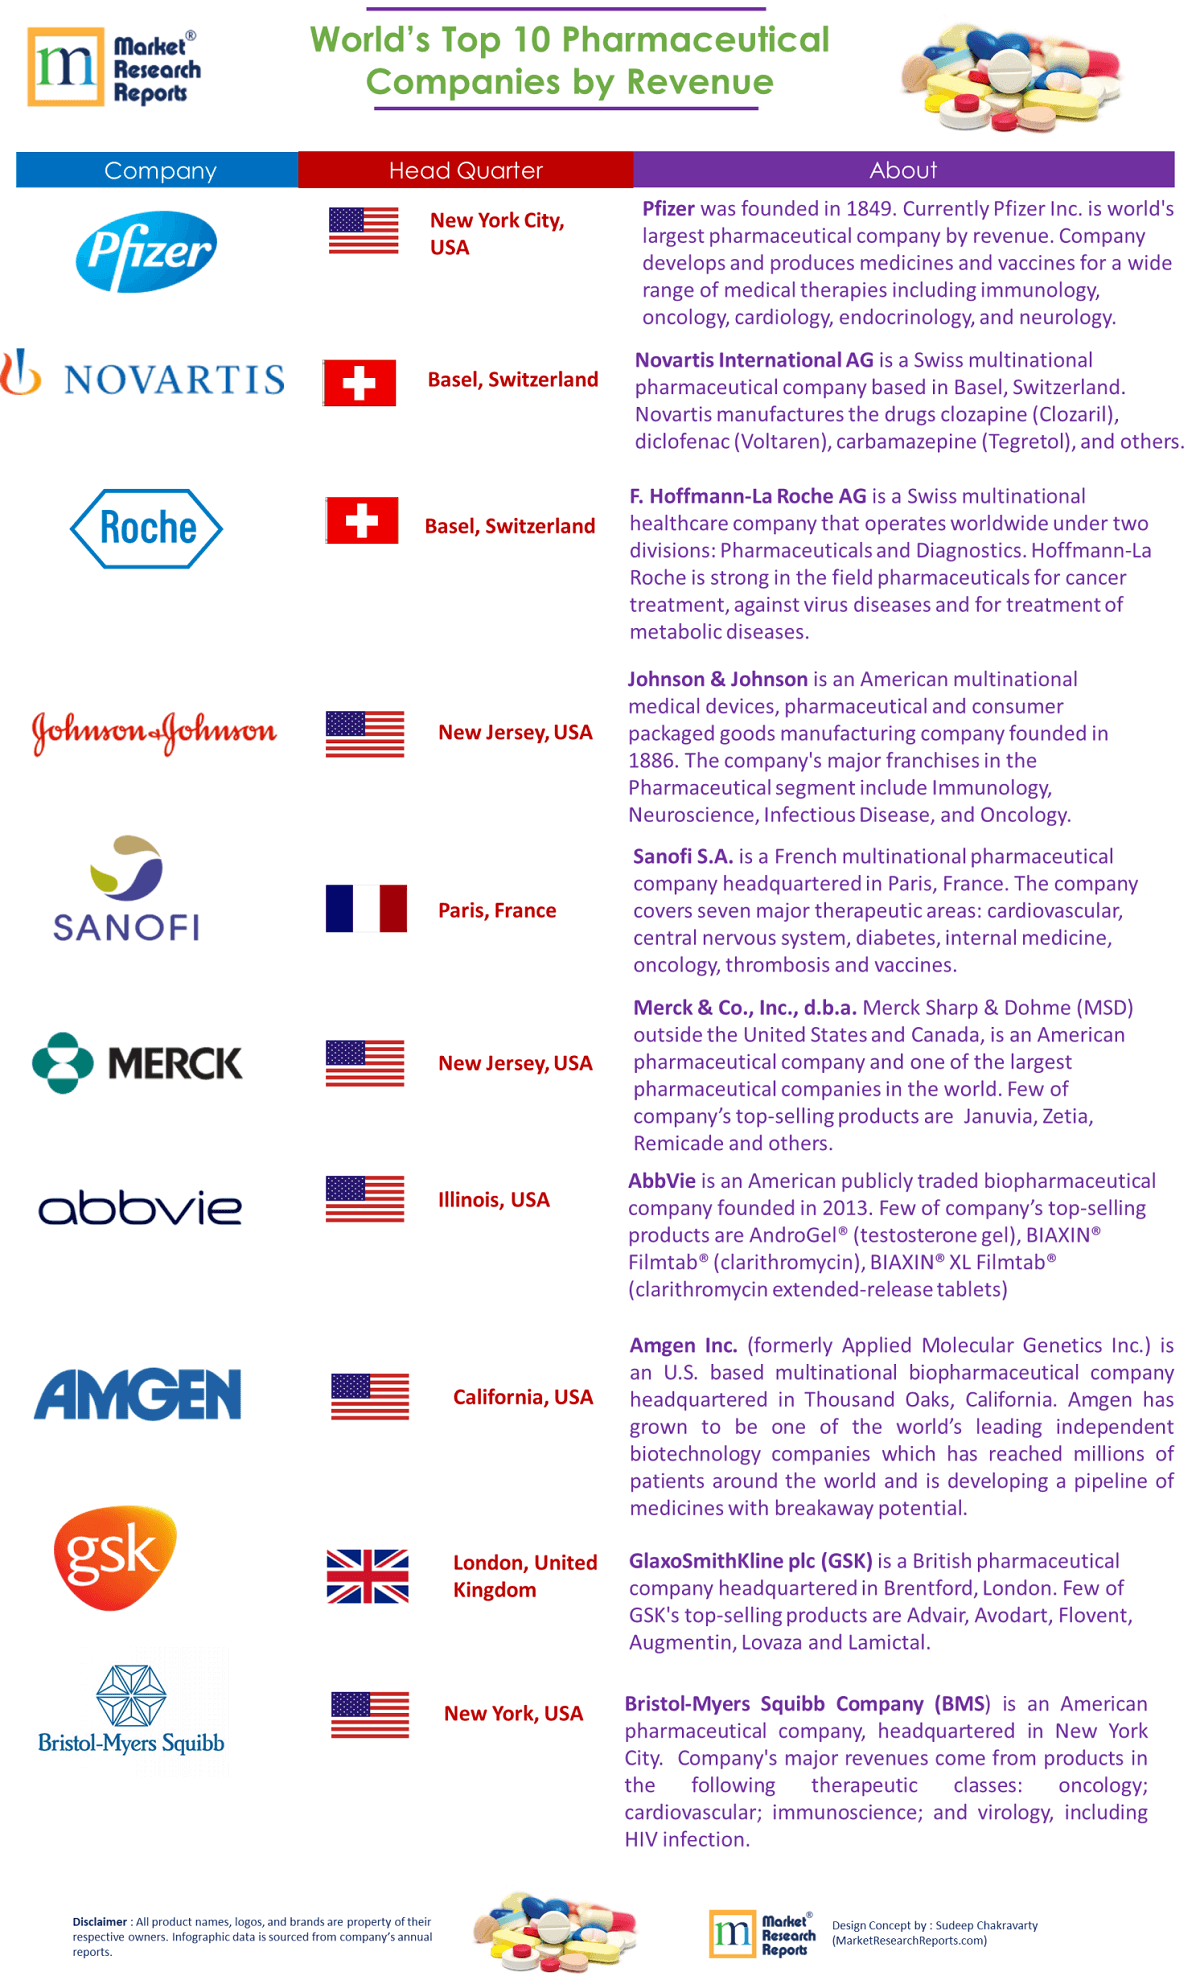
World’s Top 10 Pharmaceutical Companies by Revenue

The top 10 Pharmaceutical Companies list is now out. The rankings have been provided on the basis of pharma division/franchise revenue of listed companies for year 2018: Last Updated (7th March 2019).
- Pfizer Inc. : USD 53.647 Billion
- Novartis AG : USD 51.90 Billion
- Roche Holding AG : USD 45.5896 Billion
- Johnson & Johnson : USD 40.734 Billion
- Sanofi S.A : USD 39.288 Billion
- Merck & Co., Inc. : USD 37.689 Billion
- AbbVie Inc. : USD 32.753 Billion
- Amgen : USD 23.7 Billion
- GSK : USD 22.968 Billion
- Bristol-Myers Squibb : USD 22.600 Billion
Global Pharmaceuticals Industry Analysis and Trends 2023
Global pharmaceuticals market is expected to be worth USD 1.57 trillion by 2023.
1 . 1.Pfizer Inc
Pfizer's full-year 2018 revenues totaled $53.6 billion, an increase of $1.1 billion, or 2%, compared to full-year 2017, reflecting operational growth of $791 million, or 2%, and the favorable impact of foreign exchange of $310 million, or less than 1%.According to Pfizer's 2019 financial guidance, company anticipates continued strong growth from key product franchises, including Ibrance, Eliquis, Xeljanz and Xtandi as well as the expected loss of exclusivity of Lyrica in the U.S. in June 2019.
2 . 2.Novartis AG
Novartis AG reported revenue of USD 51.90 billion for the FY 2018 which saw an increase of 5.68% compared to FY 2017. Novartis also announced that the spin-off of Alcon is still on-track, with the company awaiting the final endorsement of the move within the first half of the year.According to company statement , "Alcon is positioned for sustainable long-term top-line growth and margin expansion as demonstrated by the strong 2018 results,” Alcon division's total sale in 2018 was USD 7.14 Billion.
3 . 3.Roche Holding AG

Roche Holding AG reported revenue of CHF 59.497 billion for the FY 2018 which saw an increase of 6.73% compared to FY 2017. Roche revenue is expected to increase by 5% and reach CHF 62.472 billion by FY 2019. Roche Holding AG registered highest revenue from United States market at including royalties which accounted for 47.20% of its total sales in FY 2018.
4 . 4.Johnson & Johnson

Johnson & Johnson is the largest healthcare company by revenue which generated a whopping USD 81.58 billion in total sales in 2018, and pharmaceuticals franchise were responsible for more than 50% of the conglomerate's top line. In 2018, annual consumer care franchise rose just 1.8% and the medical device segment generated a marginal 1.5% gain. Quite evidently, Johnson & Johnson's pharmaceutical run the show and pushed total revenue to 7% higher last year.
5 . 5.Sanofi S.A.
Sanofi’s fourth-quarter business net income was up 4.3 percent at constant exchange rates to 1.36 billion euros, while revenue rose 3.9 percent to 9 billion. Sales at Genzyme surged 37.4 percent. Net sales in 2018 were €34,463 million, down 1.7% according to latest report. The decline is mainly due to diabetes and cardiovascular (DCV) business unit performance as unit sales were down by 11.3%.Sanofi’s fourth-quarter business net income was up 4.3 percent at constant exchange rates to 1.36 billion euros, while revenue rose 3.9 percent to 9 billion.
6 . 6.Merck & Co., Inc.
Merck reported revenue of USD 42.294 billion for the FY 2018 which saw an increase of 5.41% compared to FY 2017. This revenue is expected to increase by 5.68% and reach USD 44.700 billion by FY 2019.Looking into 2019, Merck said it sees non-GAAP earnings of between $4.57 and $4.72 per share on worldwide sales of between $43.2 billion and $44.7 billion.
7 . 7.AbbVie Inc.

AbbVie Inc. reported revenue of USD 32.733 billion for the FY 2018 which saw an increase of 16% compared to FY 2017. Company's global sales were impacted by the launch of several direct biosimilar drugs. These drugs are launched at much cheaper price anticipated by AbbVie resulting decline in sales in Europe and other international markets.
8 . 8.Amgen Inc.

Amgen's full year, total revenues increased 4 percent to $23.7 billion, with 3 percent product sales growth. Company's product sales grew 8 percent globally. New and recently launched products including Repatha® (evolocumab), Prolia® (denosumab), KYPROLIS® (carfilzomib) and XGEVA® (denosumab) registered double-digit growth.
9 . 9.GlaxoSmithKline Plc
GlaxoSmithKline reported revenue of USD 40.992 billion for the FY 2018 which saw an increase of 4.46% compared to FY 2017. Consumer healthcare division had second largest revenue share with 24.85% revenue share. This division saw an increase of 1.09% compared to FY 2017 revenue.
10 . 10.Bristol-Myers Squibb Company

Bristol-Myers Squibb reports 10% increase in their fourth quarter revenues which reached to $6.0 Billion, and 9% for Full Year to $22.6 Billion.U.S. revenues increased 16% to $3.3 billion in the quarter compared to the same period a year ago. International revenues increased 3%.
DISCLAIMER: * Rankings have been provided on the basis of pharma division revenue, if you consider total revenue of a company rankings might change.
Global Pharmaceuticals Industry Analysis and Trends 2023: Report covers Competitive Landscape Of Global Pharma Companies
Related Pharmaceutical Industry Articles
1. Global Pharmaceuticals Market Forecast: Drivers, Value Chain Analysis & Trends
2. Top 15 Pharma Companies in India
3. U.S. Top 10 Pharmaceutical Companies by Market Turnover
4. World's Top Selling Pharmaceutical Drugs and Manufacturers by Sales
5. Top 6 Therapeutic Companies to Look out for Acute Renal Failure (Acute Kidney Injury)
6. Top 10 Oncology Pharma Companies in the World
7. Top 10 Antidiabetics Pharma Companies in the World